自分用メモ。説明はUbuntu用。
IntelのCPUを使ってない場合はLinux perfやtoplev、AMDなら (Intelでも動くらしい) CodeAnalyst などを使うとよさそう。
セットアップ
ダウンロード
Choose & Download > Only Intel VTune Profiler > Download
インストール
tar.gz を解凍すると install.sh と install_GUI.sh というのがある。 install_GUI.sh の方を使った。
終わると ~/intel/vtune_profiler にインストールされる。
デスクトップエントリ
ln -s ~/intel/vtune_profiler ~/.local/share/applications/vtune_profiler でとりあえず出るようになる。
vtune-gui.desktop だけでなくディレクトリごとsymlinkしたのは .desktop エントリが自身のパスから vtune-gui のパスを計算するため。
PATH
export PATH="${PATH}:${HOME}/intel/vtune_profiler/bin64"
でとりあえず vtune や vtune-gui は叩けるようになる。
GUI での実行
ターミナルから起動するとそれが閉じれなくなるので、GNOMEから Intel VTune Profiler を起動する。
計測対象の stdout が見れるようにする
≡ > Options > Application output destination: Product output window
Microarchitecture Exploration で L2/L3 を見る準備
BIOS で Hyper Threading を無効にしておく。
事前準備コマンド
rootで以下を実行する。
# Cannot start data collection because the scope of ptrace system call application is limited.
# To enable profiling, please set /proc/sys/kernel/yama/ptrace_scope to 0.
# See the Release Notes for instructions on enabling it permanently.
echo 0 > /proc/sys/kernel/yama/ptrace_scope

# Hardware collection of CPU events is not possible on this system.
# Microarchitecture performance insights will not be available.
echo 1 > /proc/sys/kernel/perf_event_paranoid

# This analysis type requires either an access to kernel-mode monitoring in the Linux perf subsystem or
# installation of the VTune Profiler drivers (see the "Sampling Drivers" help topic for further details).
# Please set the /proc/sys/kernel/perf_event_paranoid value to 1 or less to continue without installing the drivers.
echo 1 > /proc/sys/kernel/perf_event_paranoid

# This analysis type requires either an access to kernel-mode monitoring in the Linux perf subsystem or
# installation of the VTune Profiler drivers (see the "Sampling Drivers" help topic for further details).
# Please set the /proc/sys/kernel/perf_event_paranoid value to 0 or less to continue without installing the drivers.
echo 0 > /proc/sys/kernel/perf_event_paranoid

# Access to /proc/kallsyms file is limited. Consider changing /proc/sys/kernel/kptr_restrict
# to 0 to enable resolution of OS kernel module symbols.
echo 0 > /proc/sys/kernel/kptr_restrict
perf_event_paranoid とは
Controls use of the performance events system by unprivileged users (without CAP_SYS_ADMIN). The default value is 2.
-1: Allow use of (almost) all events by all users Ignore mlock limit after perf_event_mlock_kb without CAP_IPC_LOCK
>=0: Disallow ftrace function tracepoint by users without CAP_SYS_ADMIN Disallow raw tracepoint access by users without CAP_SYS_ADMIN
>=1: Disallow CPU event access by users without CAP_SYS_ADMIN
>=2: Disallow kernel profiling by users without CAP_SYS_ADMIN
alt stack
vtune: Error: Stack size provided to sigaltstack is too small. Please increase the stack size to 64K minimum.
vtune: Collection failed.
vtune: Internal Error
AMPLXE_TPSSCOLLECTOR: init:1330: attach_notification_result == tpss_er_success : attach_notification_result = 14
Assertion failed: init:1330: attach_notification_result == tpss_er_success : attach_notification_result = 14. Please contact the technical support.
-run-pass-thru=--no-altstack で直る http://hpc.ipp.ac.cn/wp-content/uploads/2015/12/documentation_2016/en/vtune_amplifier_xe/help/GUID-1A7D0D66-2BC0-4643-94AF-578A0BF22801.htm
未解決
# To profile kernel modules during the session, make sure they are available
# in the /lib/modules/kernel_version/ location.
実行結果の保存場所
~/intel/vtune/projects/sample (matrix)/r001hs のような場所。
- hs: Hotspots
- ue: Microarchitecture Exploration
- macc: Memory Access
これは単にサンプルプロジェクトのパスなので、適当にプロジェクトを作り直せばパスは変えられそう。
プロジェクトディレクトリには .vtuneproj ファイルが置かれるぽい。
実行モード
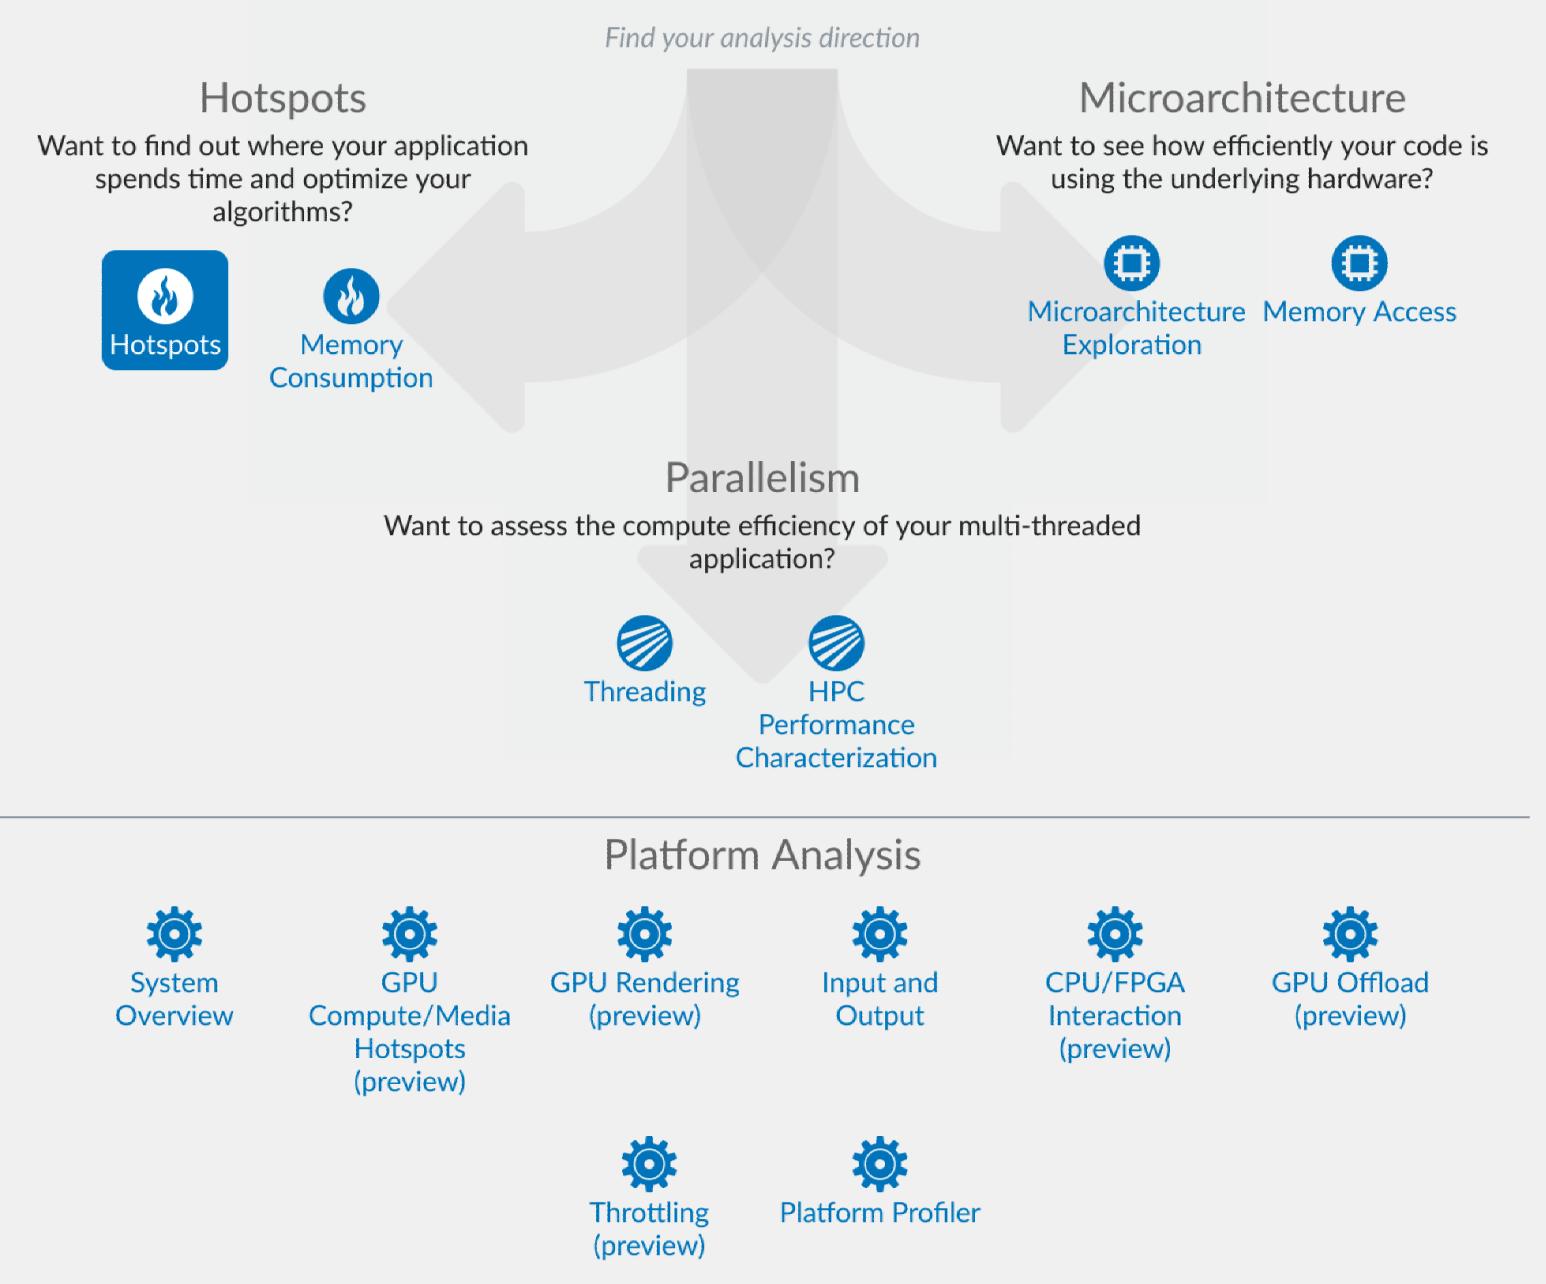
当面はシングルスレッド性能を見るのに使うので、主に以下の3つを使いそう。
- Hotspots
- Microarchitecture Exploration
- Memory Access
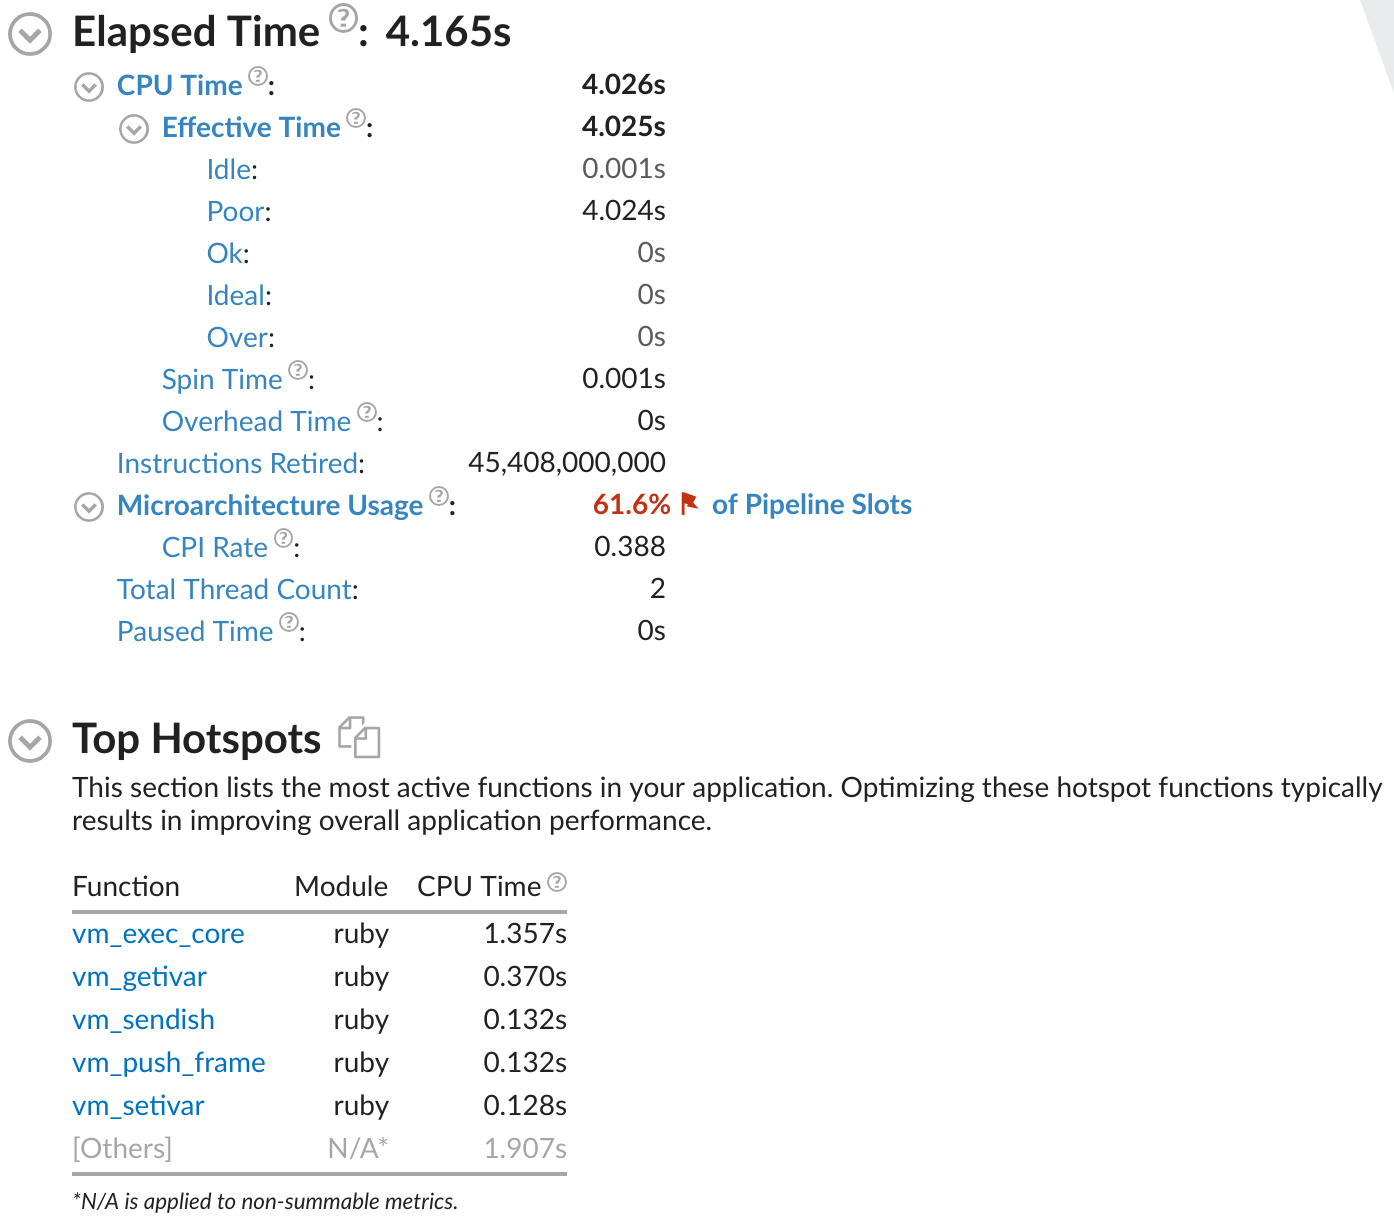
Hotspots
Summary
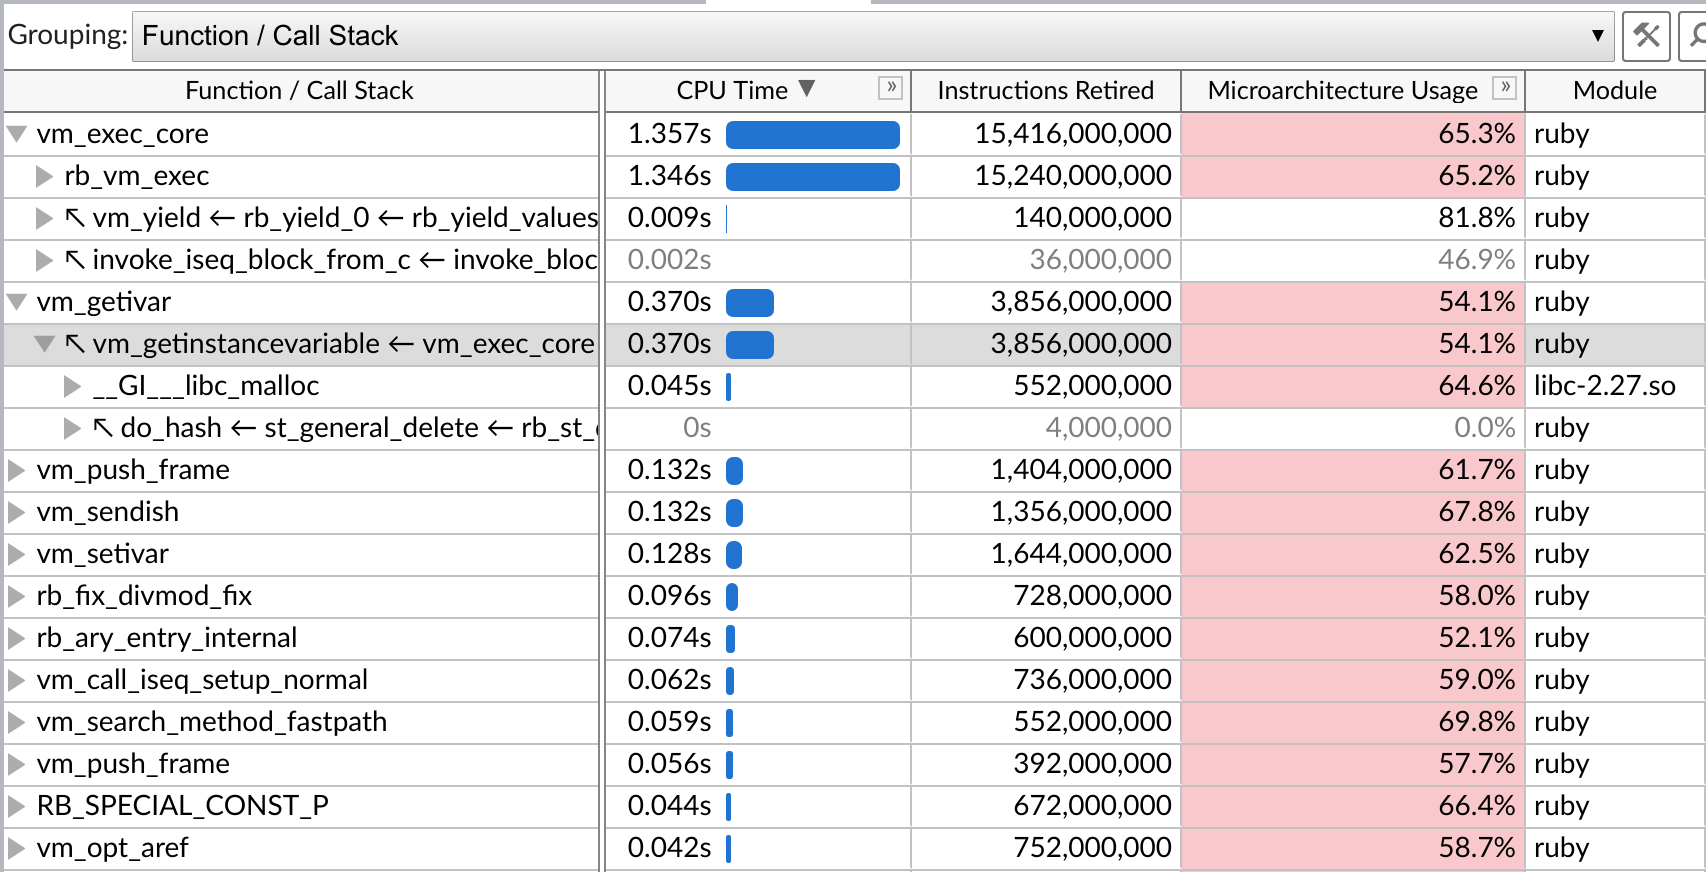
Bottom-up
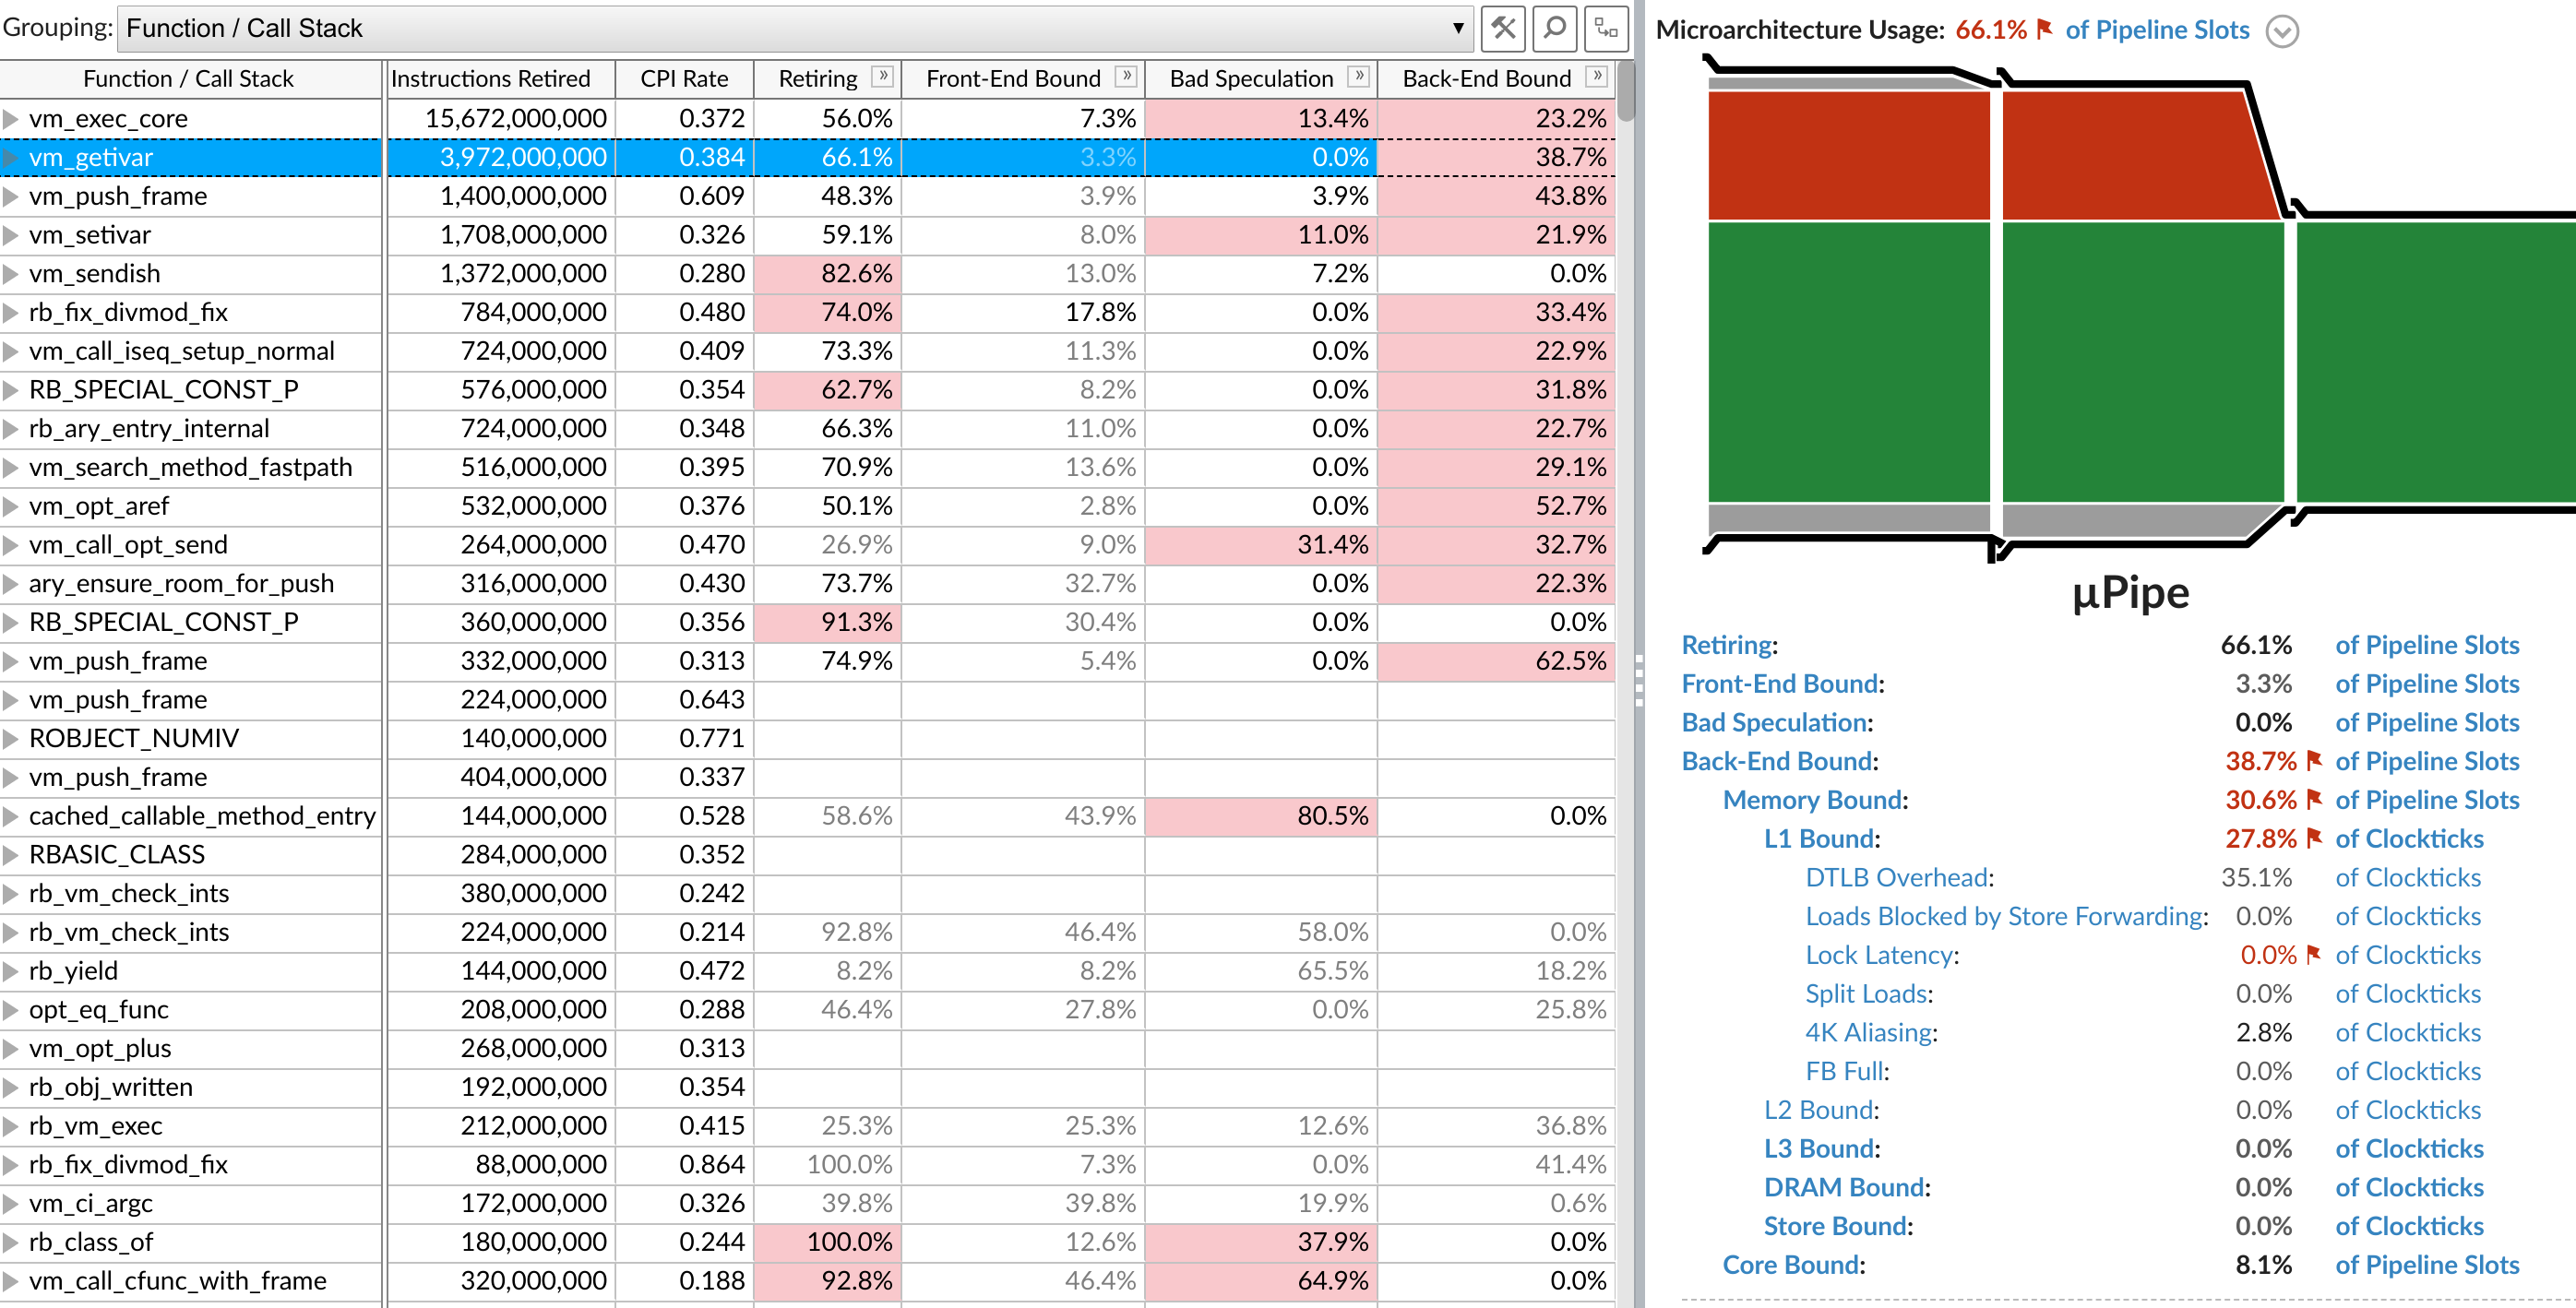
Microarchitecture Exploration
Summary
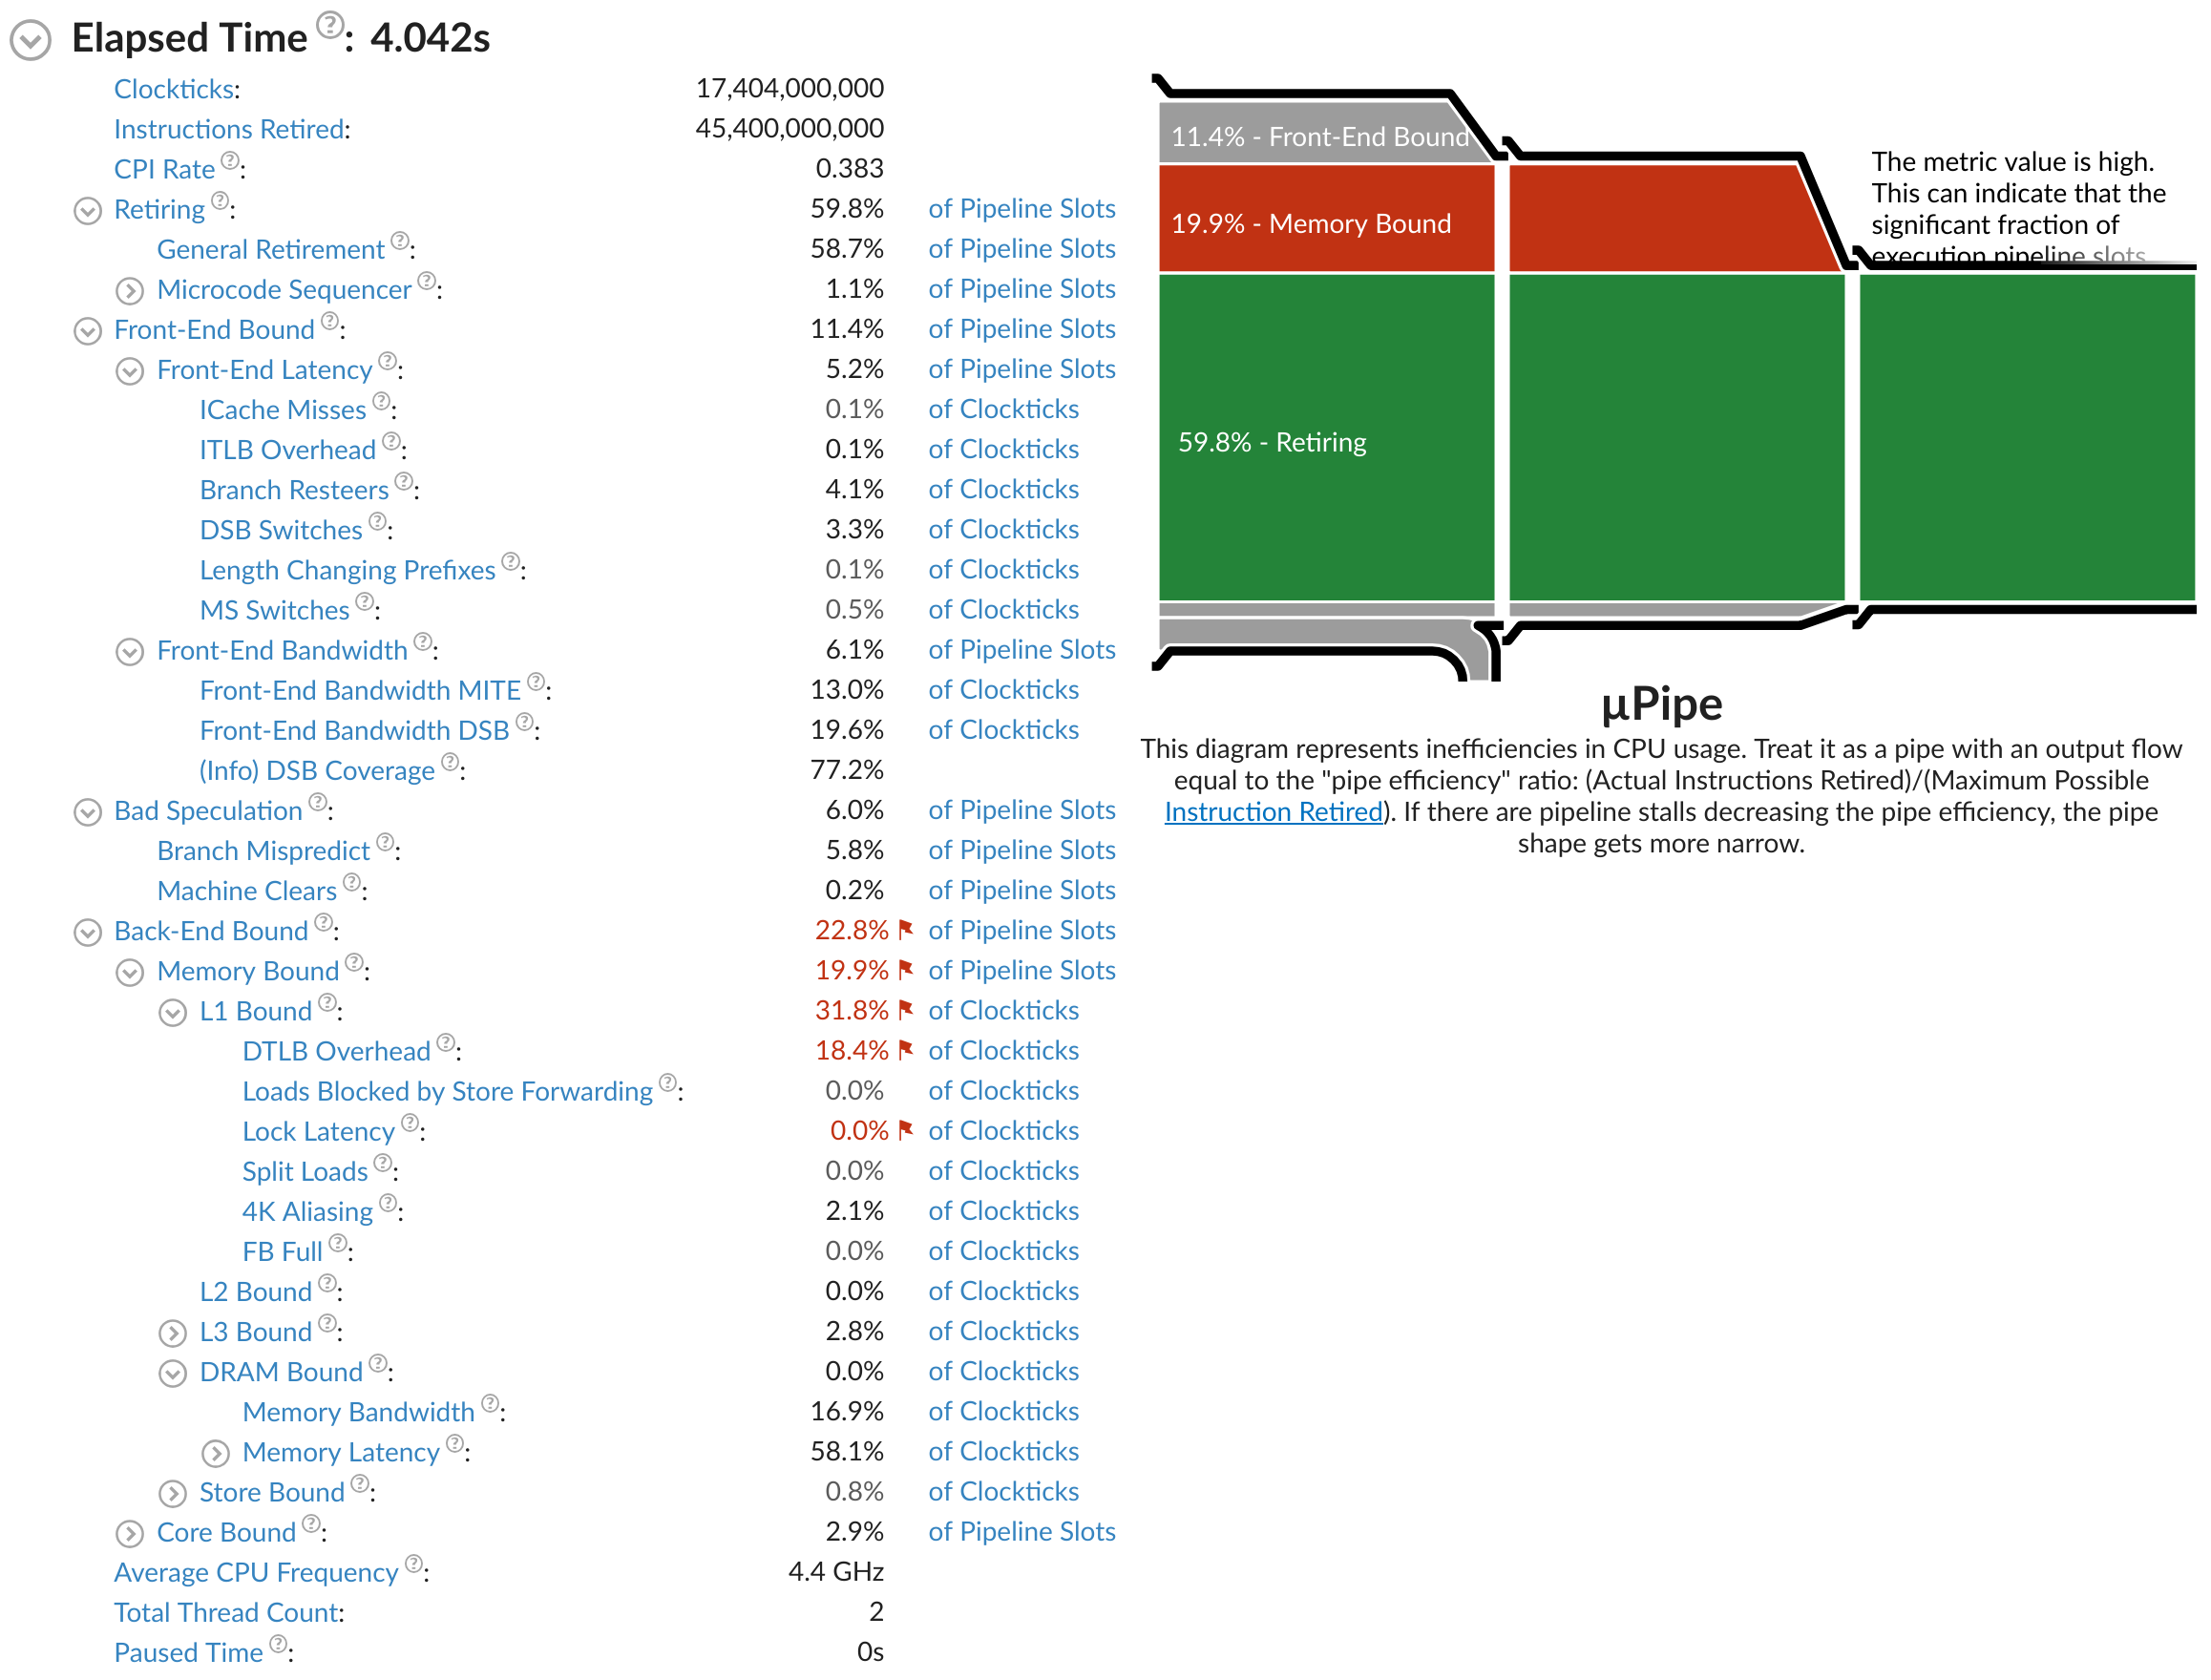
この下で、Effective CPU Utilization が 24.5% になってても 4コア / シングルスレッドアプリ では当然なので無視する。
Bottom-up
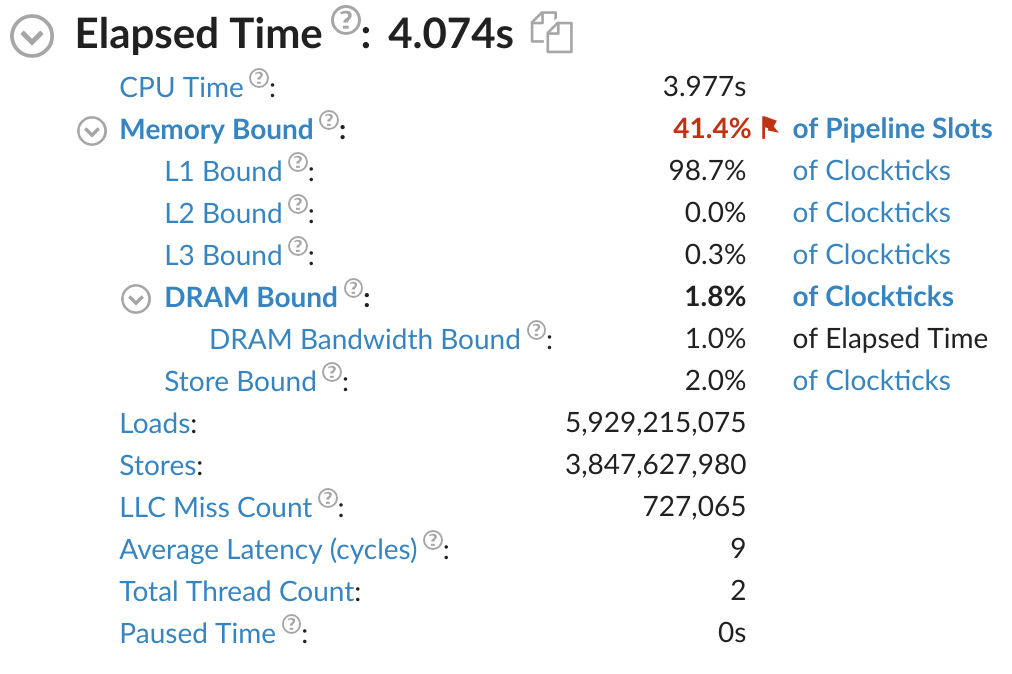
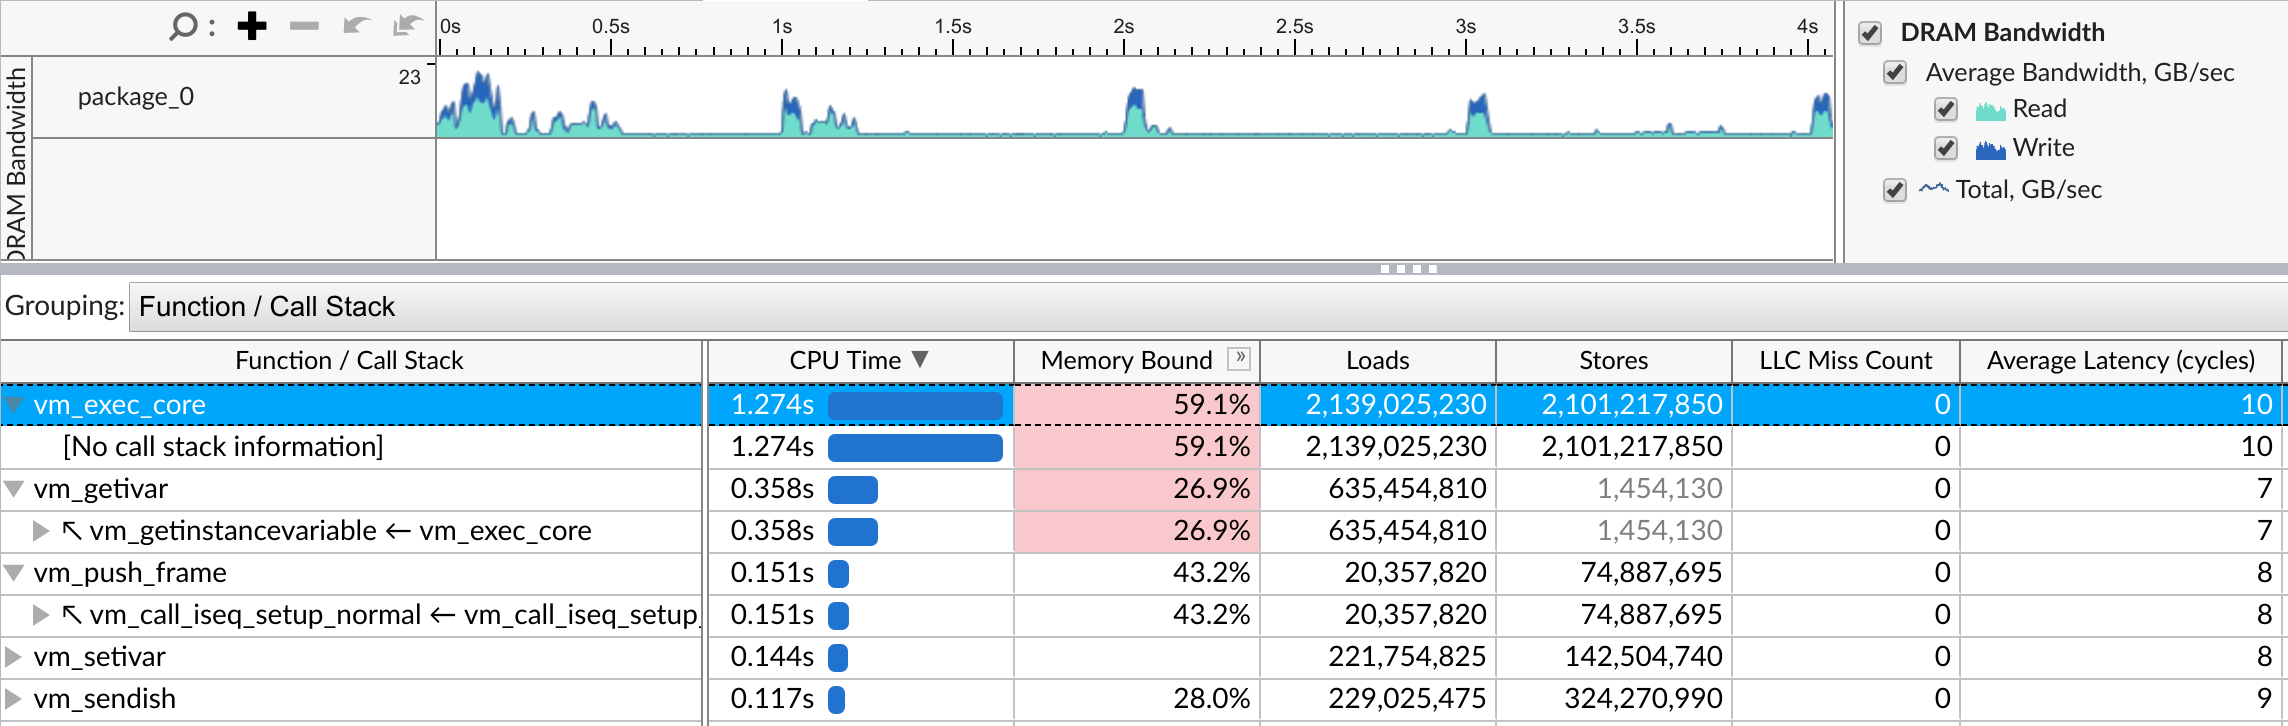
Memory Access
Summary
Bottom-up
CUI での実行
基本
# Hotspots
vtune -collect hotspots [command]

# Microarchitecture Exploration
vtune -collect uarch-exploration [command]

# Memory Access
vtune -collect memory-access [command]
カレントディレクトリに r000hs のように結果が保存される。
knobの変更
# ハードウェアサンプリング、0.5msインターバル に変更
vtune -collect hotspots -knob sampling-mode=hw -knob sampling-interval=0.5 [command]
実行例
$ vtune -collect hotspots ~/.rbenv/versions/ruby/bin/ruby bin/optcarrot-bench
vtune: Collection started. To stop the collection, either press CTRL-C or enter from another console window: vtune -r /home/k0kubun/src/github.com/mame/optcarrot/r000hs -command stop.
vtune: Error: Stack size provided to sigaltstack is too small. Please increase the stack size to 64K minimum.
fps: 50.041307146801635
vtune: Collection stopped.
vtune: Using result path `/home/k0kubun/src/github.com/mame/optcarrot/r000hs'
vtune: Executing actions 75 % Generating a report                              Elapsed Time: 4.325s
    CPU Time: 4.040s
        Effective Time: 4.040s
            Idle: 0s
            Poor: 4.040s
            Ok: 0s
            Ideal: 0s
            Over: 0s
        Spin Time: 0s
        Overhead Time: 0s
    Total Thread Count: 1
    Paused Time: 0s

Top Hotspots
Function               Module  CPU Time
---------------------  ------  --------
vm_exec_core           ruby      1.272s
vm_getivar             ruby      0.476s
vm_sendish             ruby      0.160s
rb_ary_entry_internal  ruby      0.148s
vm_push_frame          ruby      0.132s
[Others]               N/A       1.852s
Effective CPU Utilization: 24.2%
 | The metric value is low, which may signal a poor logical CPU cores
 | utilization caused by load imbalance, threading runtime overhead, contended
 | synchronization, or thread/process underutilization. Explore sub-metrics to
 | estimate the efficiency of MPI and OpenMP parallelism or run the Locks and
 | Waits analysis to identify parallel bottlenecks for other parallel runtimes.
 |
    Average Effective CPU Utilization: 0.969 out of 4
Collection and Platform Info
    Application Command Line: /home/k0kubun/.rbenv/versions/ruby/bin/ruby "bin/optcarrot-bench"
    Operating System: 4.15.0-96-generic NAME="Ubuntu" VERSION="18.04.4 LTS (Bionic Beaver)" ID=ubuntu ID_LIKE=debian PRETTY_NAME="Ubuntu 18.04.4 LTS" VERSION_ID="18.04" HOME_URL="https://www.ubuntu.com/" SUPPORT_URL="https://help.ubuntu.com/" BUG_REPORT_URL="https://bugs.launchpad.net/ubuntu/" PRIVACY_POLICY_URL="https://www.ubuntu.com/legal/terms-and-policies/privacy-policy" VERSION_CODENAME=bionic UBUNTU_CODENAME=bionic
    Computer Name: bionic
    Result Size: 3 MB
    Collection start time: 05:58:46 25/04/2020 UTC
    Collection stop time: 05:58:50 25/04/2020 UTC
    Collector Type: Driverless Perf per-process counting,User-mode sampling and tracing
    CPU
        Name: Intel(R) Core(TM) Processor code named Haswell
        Frequency: 3.999 GHz
        Logical CPU Count: 4

If you want to skip descriptions of detected performance issues in the report,
enter: vtune -report summary -report-knob show-issues=false -r <my_result_dir>.
Alternatively, you may view the report in the csv format: vtune -report
<report_name> -format=csv.
vtune: Executing actions 100 % done
保存された結果をGUIで見る
# vtune-gui r000hs など
vtune-gui [result]
開いてるプロジェクトとは別に見ることができる。
既存のプロジェクトに結果を保存する
vtune -collect=[type] -user-data-dir=[project] [command]
開きっぱなしのGUIには反映されないので不便だが、開き直せばプロジェクトの一部として認識される。
実行中のプロセスにアタッチ
vtune -collect=[type] -target-pid=[pid]
普通のユーザーでやるとSEGVしたが、対象のプロセスとvtuneをsudoで実行したら動いたこともある。
hotspotsをcollectしていたら sudo でも -run-pass-thru=--no-altstack か -knob sampling-mode=hw がないと動かなかったこともあった。
vtuneのプロセスにSIGINTしても効かなくて、target pidのプロセスがexitするまで計測が終わらない。
help
# vtuneのhelp
vtune -help

# collectのhelp
vtune -help collect

# hotspotsのhelp (knobが見れる)
vtune -help collect hotspots