MatrixProfileにより時系列データマイニングがレボリューションだそうです。
が、日本語の文献はまだまだ少ないようなので、足しになればと思います。
本記事では、MatrixProfileの概要とPythonによる実装例を紹介します。
MatrixProfileとは
部分時系列同士の類似結合のことです。
時系列データのペア(A,B)を考えます(同じ時系列同士のペアでも構いません)。
それぞれの時系列は長さmの部分時系列に分解されます。
A内のすべての部分時系列について、それに最も近いB内の部分時系列のインデックスおよびその距離(類似度)を求めたものをMatrixProfileと呼びます。なお、もしAとBが同じ時系列だと、部分時系列も自身とのペアが最適になってしまうので、自身の部分時系列周辺は無視します。

震動データとMatrixProfileの例 [Yeh et. al, ICDM2016]
まともに計算しようとすれば膨大な時間が必要となりますが、FFTなどを利用したアルゴリズムの工夫により現実的な時間で解くことが可能です。レボリューションですよね。
詳細はhttps://www.cs.ucr.edu/~eamonn/MatrixProfile.html
SAXやShapeletで有名なUCRのKeogh先生の研究室発の技術だそうです。
論文のタイトルがMatrix Profile 〇〇:みたいな形でシリーズ化されているようで、2019年11月現在Matrix Profile XIX:までパブリッシュされているみたいです。
MatrixProfile用ライブラリ"matrixprofile-ts"
matrixprofile-tsという超お手軽なMatrixProfile専用Pythonライブラリがすでに存在します。
pip install matrixprofile-ts
こちらでも入手可能です。RやC++のものもあるらしいです。
今回はこのmatrixprofile-tsを使ってECGデータの異常検知を試みます。
問題設定
今回は異常波形部位を含んだ一連のECGデータを用いて、教師なしで各点の異常度を計算し、その異常部位を特定するといった問題になります。
以下、実装に移ります。
ECGデータの読込
今回はqtdbsel102と呼ばれるECGデータを用います。
https://www.cs.ucr.edu/~eamonn/discords/qtdbsel102.txt
こちらもKeogh先生の論文で用いられたデータです。
データ長が非常に長いため、初めの5000点を用いることにします。
ちなみにMatrixProfileでは計算過程で正規化されるため、前処理は必要ありません。
from matrixprofile import *
import pandas as pd
import numpy as np
import matplotlib.pyplot as plt

# データの読み込み
ECG = pd.read_csv('qtdbsel102.txt', header=None, delimiter='\t')
X = ECG.values[:5000,2]

# ECGの可視化
plt.style.use('seaborn')
plt.figure(figsize=(16, 8))
plt.xlim(0, 5000)
plt.plot(X)
plt.axvspan(4200, 4400, facecolor='r', alpha=0.1)

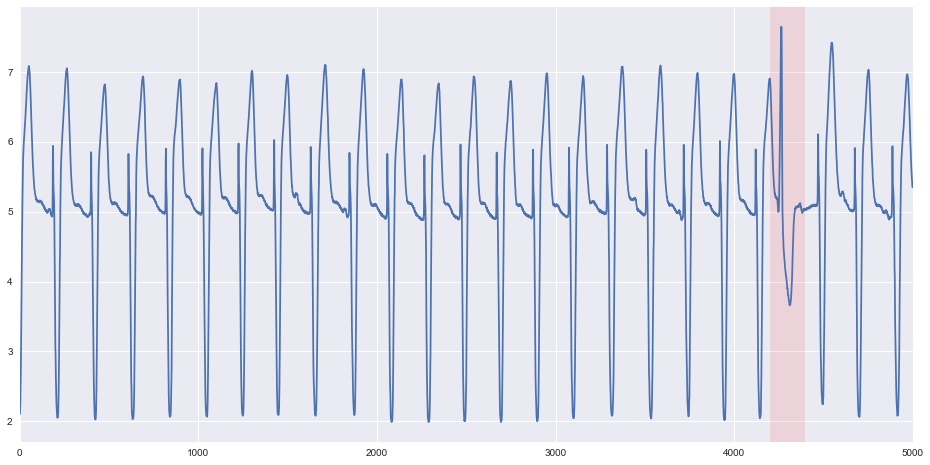
4200点~4400点付近異常波形が出現しています。一目瞭然ですね。
MatrixProfileの計算
優秀なライブラリのおかげでお手軽に実装出来ます。
ハイパーパラメータは部分時系列の長さだけです。今回は200に設定します。
計算手法は精度はやや落ちるものの最速かつ最新の手法である**SCRIMP++**を使ってみます。
# matrixProfileの計算
window_size = 200
MP = matrixProfile.scrimp_plus_plus(X,window_size)
異常検知
ECGのような周期性を持つデータにおいて、正常な部分時系列は自身と非常に似通った波形が他の箇所にも確認されるはずです。
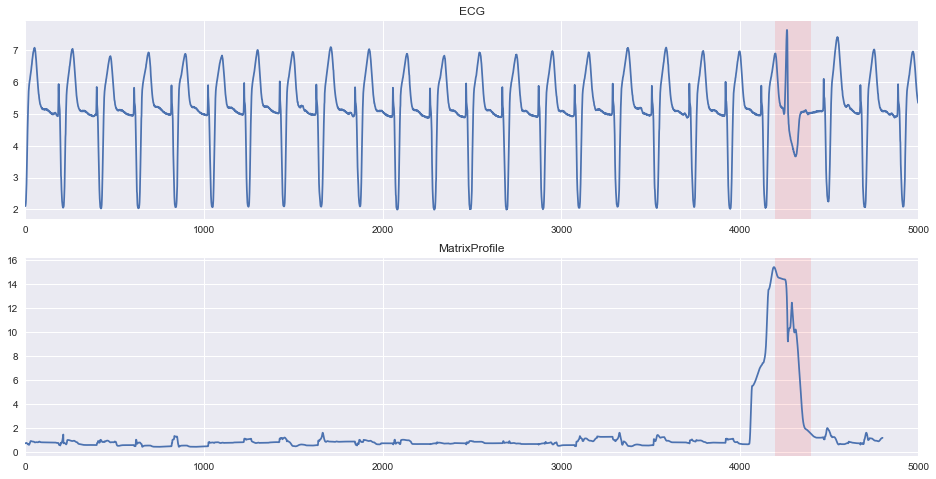
逆に言えば、自身と似通った波形が存在しない、つまりMatrixProfileの距離の値が大きくなる部分が異常と考えられます。いわゆる近傍法です。
さて、先ほど計算したMP内には距離列と参照インデックス列が格納されています。
距離列を確認し、可視化してみましょう。
# MatrixProfileの可視化
plt.figure(figsize=(16, 8))

plt.subplot(2,1,1)
plt.xlim(0, 5000)
plt.title('ECG')
plt.plot(X)
x = np.arange(4200,4400)
plt.axvspan(4200, 4400, facecolor='r', alpha=0.1)

plt.subplot(2,1,2)
plt.xlim(0, 5000)
plt.title('MatrixProfile')
plt.plot(MP[0])
plt.axvspan(4200, 4400, facecolor='r', alpha=0.1)

うまく異常が検知出来ていることが確認出来ます。
さらに、MatrixProfileの値が最大となる箇所の波形、つまり最も異常な箇所の波形を確認してみましょう。
# MatrixProfile最大の波形とその最近傍波形
max_point_index = np.argmax(MP[0])
nearest_neighbor_index = MP[1][max_point_index]
plt.tight_layout()
fig, ax = plt.subplots(1, 3, figsize=(22, 6))


ax[0].plot(X[max_point_index:max_point_index+window_size], linewidth=5, color = "r")
ax[0].title.set_text("mp_peak(anormaly_wave)")

ax[1].plot(X[nearest_neighbor_index:nearest_neighbor_index+window_size], linewidth=5, color = "b")
ax[1].title.set_text("nearest_neighbor")

from sklearn.preprocessing import StandardScaler
S = StandardScaler()

ax[2].title.set_text("comparison")
ax[2].plot(S.fit_transform(X[max_point_index:max_point_index+window_size].reshape(-1,1)).flatten(), linewidth=5, color = "r")
ax[2].plot(S.fit_transform(X[nearest_neighbor_index:nearest_neighbor_index+window_size].reshape(-1,1)).flatten(), linewidth=5, color = "b")

一番左の波形がMatrixProfile最大の波形、真ん中がそれの最近傍波形、そして一番右がそれぞれの波形をz正規化して比較したものです。
さて、私はECGの専門家ではないので波形の意味までは理解出来ないのですが、まあ異常波形はピークが大きかったり凹みが小さかったり、そもそも位相がずれていたりと、正常波形との様々な差異が確認出来ますね。インタプリタブルでいい感じです。
MatrixProfileの強み
「異常検知なんて他の手法でも出来るじゃないか。ディープなラーニングでいいじゃないか。」
そう思われる方も多いかもしれません。
しかし、MatrixProfileの魅力はそのシンプルさにあります。
MatrixProfileの計算過程にアメージングな斬新さはあれど、最終的に出力しているのは単なる部分波形同士のマッチングに過ぎません。つまり、異常が検出されたとして、その妥当性を人が容易にチェックすることが出来ます。信頼性やトラクタビリティといった観点において右に出るものはないでしょう。
さらに、今回の異常波形検出はMatrixProfileの持つ機能の1つに過ぎません。MotifやShapeletの発見をはじめとして、数多くの応用先があるらしいです。レボリューションですよね。
まとめ
MatrixProfileを紹介し、matrixprofile-tsと呼ばれるライブラリを試しました![]()