はじめに
goのプロファイリングツールをgo-ginを使ったシステム上で動かす方法です。
こちらのpackageを使うことでgo-ginのエンドポイントとしてpprofのエンドポイントを晒すことができます。
準備
go get github.com/gin-gonic/gin
go get github.com/gin-contrib/pprof
graphvizを使うのでインストールしてください。
brew install graphviz
現時点では最新タグがpprofエンドポイントを網羅しておらず、masterだと網羅しているため
depなど使う人はmasterを明示的に指定する方がいいです。
Gopkg.toml
[[constraint]]
  name = "github.com/gin-contrib/pprof"
  branch = "master"
サンプルコード
package main

import (
	"github.com/gin-contrib/pprof"
	"github.com/gin-gonic/gin"
	"net/http"
)

func main() {
	r := gin.Default()
	pprof.Register(r)

	r.GET("/", func(ctx *gin.Context) {
		for h := 0; h< 100000000; h++ {}
		ctx.JSON(http.StatusOK, gin.H{"status": "ok"})
	})

	r.Run(":8080")
}
実行
実行するとこのようなエンドポイントが設定されているのがわかります。
[GIN-debug] [WARNING] Now Gin requires Go 1.6 or later and Go 1.7 will be required soon.
[GIN-debug] [WARNING] Creating an Engine instance with the Logger and Recovery middleware already attached.
[GIN-debug] [WARNING] Running in "debug" mode. Switch to "release" mode in production.
 - using env:	export GIN_MODE=release
 - using code:	gin.SetMode(gin.ReleaseMode)

[GIN-debug] GET    /debug/pprof/             --> github.com/gin-contrib/pprof.pprofHandler.func1 (3 handlers)
[GIN-debug] GET    /debug/pprof/cmdline      --> github.com/gin-contrib/pprof.pprofHandler.func1 (3 handlers)
[GIN-debug] GET    /debug/pprof/profile      --> github.com/gin-contrib/pprof.pprofHandler.func1 (3 handlers)
[GIN-debug] POST   /debug/pprof/symbol       --> github.com/gin-contrib/pprof.pprofHandler.func1 (3 handlers)
[GIN-debug] GET    /debug/pprof/symbol       --> github.com/gin-contrib/pprof.pprofHandler.func1 (3 handlers)
[GIN-debug] GET    /debug/pprof/trace        --> github.com/gin-contrib/pprof.pprofHandler.func1 (3 handlers)
[GIN-debug] GET    /debug/pprof/block        --> github.com/gin-contrib/pprof.pprofHandler.func1 (3 handlers)
[GIN-debug] GET    /debug/pprof/goroutine    --> github.com/gin-contrib/pprof.pprofHandler.func1 (3 handlers)
[GIN-debug] GET    /debug/pprof/heap         --> github.com/gin-contrib/pprof.pprofHandler.func1 (3 handlers)
[GIN-debug] GET    /debug/pprof/mutex        --> github.com/gin-contrib/pprof.pprofHandler.func1 (3 handlers)
[GIN-debug] GET    /debug/pprof/threadcreate --> github.com/gin-contrib/pprof.pprofHandler.func1 (3 handlers)
[GIN-debug] GET    /                         --> main.main.func1 (3 handlers)
[GIN-debug] Listening and serving HTTP on :8080
あとはvegetaなんかで殴りつつpprofを叩きましょう。
echo "GET http://localhost:8080/" | vegeta attack -duration=1s -workers=1 -rate=1 | vegeta report
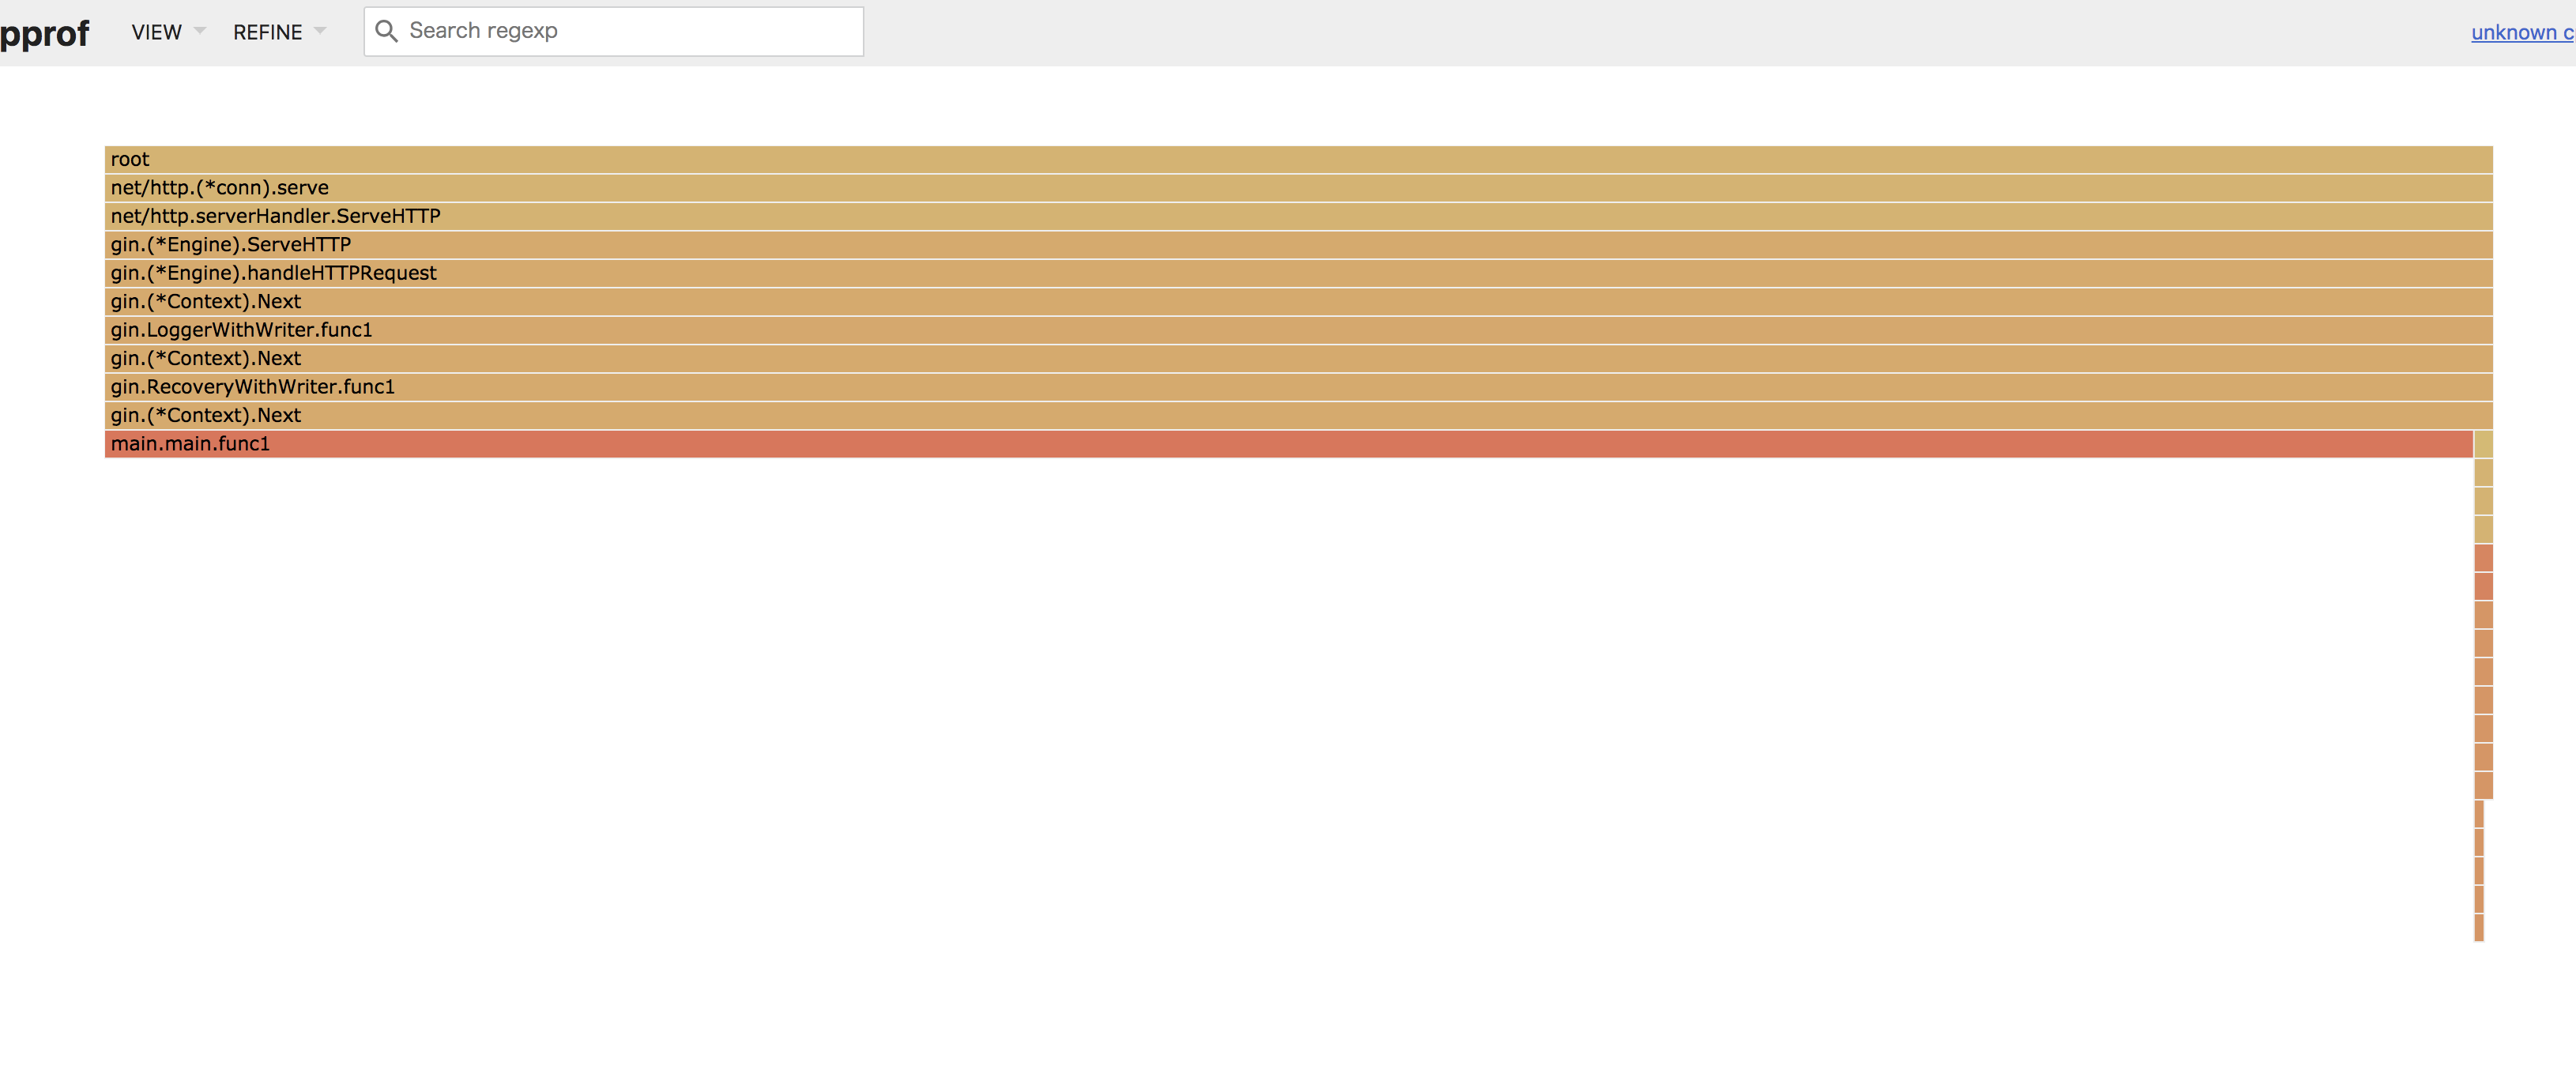
go tool pprof -http=":8888" localhost:8080/debug/pprof/profile
こういう感じのプロファイル結果が出ます。(xhprofみたいですね)

ちなみにgo toolに同梱されているpprofですがgoogleリポジトリで最新バージョンを取得することができます。
Flame Grapthなるものを表示できたり、go toolにはまだ実装されて無い機能を使うことができます。
以上です。