Topological Data Analysisとは
トポロジーは”形”を扱う数学の一分野です。高次元空間内の多数のデータが表す形をそのデータの特徴として捉え、これを解析するのがTopological Data Analysis(TDA)と呼ばれるデータ解析手法です。TDAは自然言語処理や画像認識など様々な分野で応用されています。このTDAを使ってscRNA-seqのデータを解析してみました。
Single cell RNA-seq(scRNA-seq)
多細胞生物の個体内では、全ての細胞が基本的に同じ遺伝子を持っています。しかし、その中で発現している遺伝子は細胞ごとに異なります。細胞中で発現している全ての遺伝子を検出する技術がRNA-seqで、そのRNA-seqを一細胞レベルで行うのがsingle cell RNA-seq(scRNA-seq)になります。scRNA-seqは細胞の多様性を遺伝子発現レベルで解析するのに適した技術です。最近ではがん幹細胞の多様性や、分化プロセスにおける細胞の多様性などが良く研究されています。
scRNA-seqデータの解析
現在、ヒトでは2万数千個の遺伝子が同定されています。RNA-seqを使うと全ての遺伝子の発現量が得られます。scRNA-seqでは数千~数万細胞のデータを扱うので、数千~数万の約20000次元のデータを解析することになります。このような大量の高次元データを解析するのにTDAは適した方法となります。
データセット
今回の解析では公共のデータベースに公開されているデータを使いました。GEOデータベースに公開されているもので、accession number はGSE67310です。GSE67310_iN_data_log2FPKM_annotated.txt.gzと言う発現量をFPKM値に換算したデータを取得できます。
各遺伝子の発現量と、タイムポイント(time_point)、細胞種(assignment)などの情報が記載されています。
iNeuron
mouseのembryonic fibroblastにAscl1遺伝子を強制発現すると細胞のリプログラムが起こり、未分化な状態に戻り、神経細胞に分化することが可能となります。分化開始から5時点(day0, day2, day5 day20, day22)で細胞を採取しscRNA-seqを行っています。
python コード
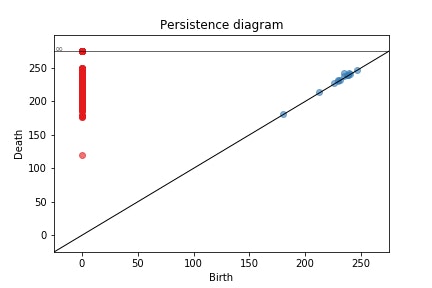
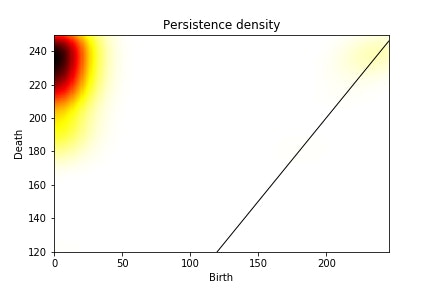
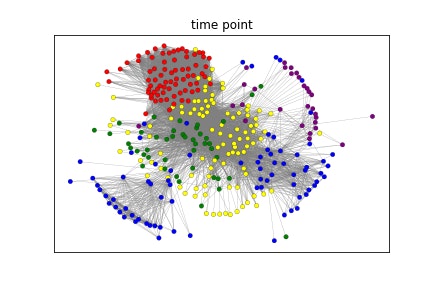
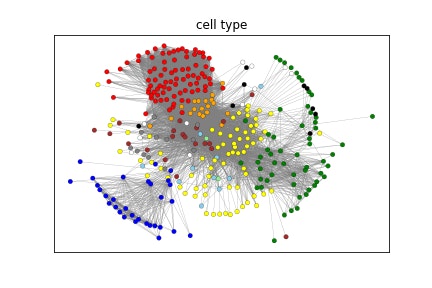
Vietris-Rips filtrationを実行して単体複体を得ます。1次の単体がデータ点同士を結んだ線分です。これをnetworkxを使って無向グラフとして図示してみました。
# Load libraries
import numpy as np
import pandas as pd
import gudhi as gd
import networkx as nx
# Reading data
x = pd.read_csv('GSE67310_iN_data_log2FPKM_annotated.txt', delimiter = '\t')
# Triming data
y = x.drop('cell_name', axis = 1)
y = y.drop('assignment', axis = 1)
y = y.drop('log_tauGFP_intensity', axis = 1)
y = y.drop('experiment', axis = 1)
y = y.drop('time_point', axis = 1)
y.index = x.cell_name
# Creating color table by day
day_color = pd.DataFrame()
for i in range(len(x)):
  if x.time_point[i] == 0:
    day_color[y.index[i]] = 'red'
  elif x.time_point[i] == 2:
    day_color[y.index[i]] = 'yellow'
  elif x.time_point[i] == 5:
    day_color[y.index[i]] = 'green'
  elif x.time_point[i] == 20:
    day_color[y.index[i]] = 'purple'
  else:
     day_color[y.index[i]] = 'blue'
# Creating color table by cell type
type_color = pd.Series()
for i in range(len(x)):
  if x.assignment[i] == 'MEF':
    type_color[y.index[i]] = 'red'
  elif x.assignment[i] == 'd2_induced':
    type_color[y.index[i]] = 'yellow'
  elif x.assignment[i] == 'd2_intermediate':
    type_color[y.index[i]] = 'orange'
  elif x.assignment[i] == 'd5_earlyiN':
    type_color[y.index[i]] = 'skyblue'
  elif x.assignment[i] == 'd5_earlyMyocyte':
    type_color[y.index[i]] = 'lightgeen'
  elif x.assignment[i] == 'd5_intermediate':
    type_color[y.index[i]] = 'brown'
  elif x.assignment[i] == 'd5_failedReprog':
    type_color[y.index[i]] = 'gray'
  elif x.assignment[i] == 'd22_failedReprog':
    type_color[y.index[i]] = 'black'
  elif x.assignment[i] == 'Neuron':
    type_color[y.index[i]] = 'blue'
  elif x.assignment[i] == 'Myocyte':
    type_color[y.index[i]] = 'green'
  else:
    type_color[y.index[i]] = 'white'
# Computing Vietris-Rips complex
rips = gd.RipsComplex(y.values, max_edge_length = 250)
# Computing simplex tree
simplex_tree = rips.create_simplex_tree(max_dimension = 2)
# Computing skeleton
skeleton = simplex_tree.get_skeleton(2)
# Getting persistence diagram
diag = simplex_tree.persistence()
# Plotting persistence diagram
gd.plot_persistence_diagram(diag)
# Plotting persistence density
gd.plot_persistence_density(diag)
# Constructing netowrk
g = nx.Graph()
for i in range(len(skeleton)):
  if len(skeleton[i][0]) == 2:
    g.add_edge(y.index[skeleton[i][0][0]], y.index[skeleton[i][0][1]])
layout = nx.kamada_kawai_layout(g)
nx.draw_networkx_nodes(g,layout,lineidths=0.2, edgecolors='black', node_size=20, node_color = day_color[list(g.nodes())].values)
nx.draw_networkx_edges(g, layout, width = 0.2, edge_color = 'gray')
nx.draw_networkx_nodes(g,layout,lineidths=0.2, edgecolors='black', node_size=20, node_color = type_color[list(g.nodes())].values)
nx.draw_networkx_edges(g, layout, width = 0.2, edge_color = 'gray')
time pointで色分けすると、day 0(赤)からday 22(青)に向けて広がっており、遺伝子発現パターンが多様化していくことが解ります。細胞種で色分けすると、day 22の細胞がNeuron(青)とMyocyte(緑)に分かれていることが解ります。
結論
scRNA-seqのデータをTDAで解析してみました。time pointや細胞種で細胞が分かれており、きれいにクラスタ化できたと思います。scRNA-seqデータの解析にTDAが有効なんじゃないでしょうか。
参考
GUDHI Python modules documentation
Treutlein B, Lee QY, Camp JG, Mall M et al. Dissecting direct reprogramming from fibroblast to neuron using single-cell RNA-seq. Nature 2016 Jun 16;534(7607):391-5.
GSE67310


