1.はじめに
今回は、機械学習に使われる分類モデルの性能評価を、コードを作りながら行ってみます。
2.データセット
使用するデータセットは、sklearnに付属している乳ガンのデータです。
import numpy as np
import pandas as pd
import matplotlib.pyplot as plt
from sklearn.datasets import load_breast_cancer
from sklearn.preprocessing import StandardScaler
from sklearn.neighbors import KNeighborsClassifier
from sklearn.linear_model import LogisticRegression
from sklearn.svm import SVC
from sklearn.tree import DecisionTreeClassifier
from sklearn.ensemble import RandomForestClassifier
from sklearn.ensemble import GradientBoostingClassifier
from sklearn.neural_network import MLPClassifier
from sklearn.pipeline import Pipeline
from sklearn.model_selection import train_test_split
from sklearn import metrics
from sklearn.metrics import accuracy_score

# ----------- データセット準備 --------------
dataset = load_breast_cancer()
X = pd.DataFrame(dataset.data, columns=dataset.feature_names)
y = pd.Series(dataset.target, name='y')
X_train,X_test,y_train,y_test=train_test_split(X, y, test_size=0.3, random_state=1)
print('X_train.shape = ', X_train.shape)
print('X_test.shape = ', X_test.shape)
print(y_test.value_counts())

データセットを学習データ:テストデータ=7:3で分割します。テストデータは 171個、特徴量は30項目で、171個のデータの内 1:正常者が108個 、0:ガン患者が63個、です。
3.分類モデル
今回使用する分類モデルは8つです。後で、使い易い様に、パイプラインの形でまとめます。ハイパーパラメータはデフォルトです。
# ---------- パイプラインの設定 ----------
pipelines = {
    '1.KNN':
        Pipeline([('scl',StandardScaler()),
                  ('est',KNeighborsClassifier())]),
    '2.Logistic':
        Pipeline([('scl',StandardScaler()),
                  ('est',LogisticRegression(solver='lbfgs', random_state=1))]), # solver
    '3.SVM':
        Pipeline([('scl',StandardScaler()),
                  ('est',SVC(C=1.0, kernel='linear', class_weight='balanced', random_state=1, probability=True))]),
    '4.K-SVM':
        Pipeline([('scl',StandardScaler()),
                  ('est',SVC(C=1.0, kernel='rbf', class_weight='balanced', random_state=1, probability=True))]),
    '5.Tree':
        Pipeline([('scl',StandardScaler()),
                  ('est',DecisionTreeClassifier(random_state=1))]),
    '6.Random':
        Pipeline([('scl',StandardScaler()),
                  ('est',RandomForestClassifier(random_state=1, n_estimators=100))]),  ###
    '7.GBoost':
        Pipeline([('scl',StandardScaler()),
                  ('est',GradientBoostingClassifier(random_state=1))]),
    '8.MLP':
        Pipeline([('scl',StandardScaler()),
                  ('est',MLPClassifier(hidden_layer_sizes=(3,3),
                                       max_iter=1000,
                                       random_state=1))])
}
1.KNN
分類したいデータに最も近いk個のサンプルを、学習データの中から見つけ出し、k個のサンプル多数決でデータを分類する、k近傍法(k-nearest neighbor)です。
2.Logistic
特徴ベクトルと重みベクトルの内積結果を確率に変換し分類する、ロジスティック回帰(Logistic Regression)です。
3.SVM
マージンの最大化を目的として分類する、サポートベクトルマシン(Support Vector Machine)です。
4.K-SVM
射影関数を使って学習データをより高い次元の特徴空間に変換しSVMで分類する、カーネル・サポートベクトルマシン (kernel Support Vector Machine)です。
5.Tree
決定木(Decision Tree)による分類モデルです。
6.Random
ランダムに選んだ特徴量から複数の決定木を作成し、全ての決定木の予測を平均して出力するランダムフォレスト(Random Forest)です。
7.GBoost
既存のツリー群が説明しきれない情報(残差)を後続するツリーが説明しようとする形で、予測精度を高める、勾配ブースティング(Gradinet Boosting)です。
8.MLP
順伝播型ニューラルネットワークの一種である、多層パーセプトロンです。
4.accuracy(精度)
# -------- accuracy ---------
scores = {}
for pipe_name, pipeline in pipelines.items():
    pipeline.fit(X_train, y_train)
    scores[(pipe_name,'train')] = accuracy_score(y_train, pipeline.predict(X_train))
    scores[(pipe_name,'test')] = accuracy_score(y_test, pipeline.predict(X_test))
print(pd.Series(scores).unstack())
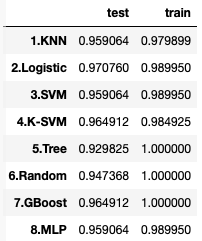
学習データとテストデータの精度(Accuracy)です。汎化性能を示す、テストデータの精度をみると、2.Logistic が 0.970760 と一番優れていることが分かります。
5.Confusion Matrix(混同行列)
分類結果を、**真陽性(true positive)、偽陰性(false negative)、偽陽性(false positive)、真陰性(true negative)**の4つに分け、正方行列にしたものを、**混同行列(Confusion Matrix)**といいます。
下記は、ガン検診の予測結果を Confusion Matrix で表した例です。
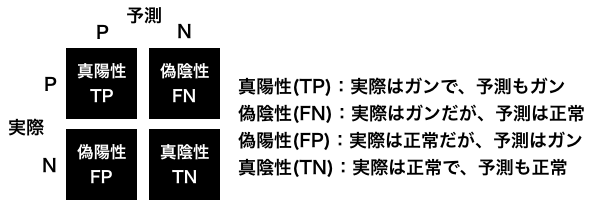
精度は、(TP+TN)/(TP+FN+FP+TN)で表されるわけですが、ガン検診の場合、FPが増えることにはある程度目をつぶり、FNをどれだけ下げられるかも重要な視点です。
# ---------- Confusion Matrix ---------
from sklearn.metrics import confusion_matrix
import seaborn as sns
for pipe_name, pipeline in pipelines.items():
    cmx_data = confusion_matrix(y_test, pipeline.predict(X_test))
    df_cmx = pd.DataFrame(cmx_data)
    plt.figure(figsize = (3,3))
    sns.heatmap(df_cmx, fmt='d', annot=True, square=True)
    plt.title(pipe_name)
    plt.xlabel('predicted label')
    plt.ylabel('true label')
    plt.show()
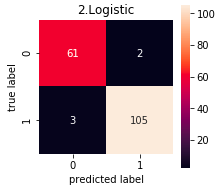
コードの出力は8つですが、代表として、2.Lostic の Confusion Matrix をみると、ガン患者63人の内2人は間違えて正常に分類することが分かります。
6.accuracy, recall, precision, f1-score
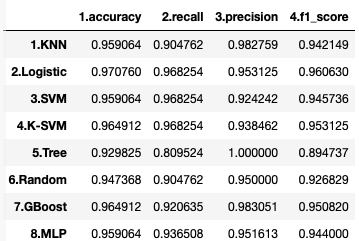
Confusion Matrix から下記の4つの指標が得られます。
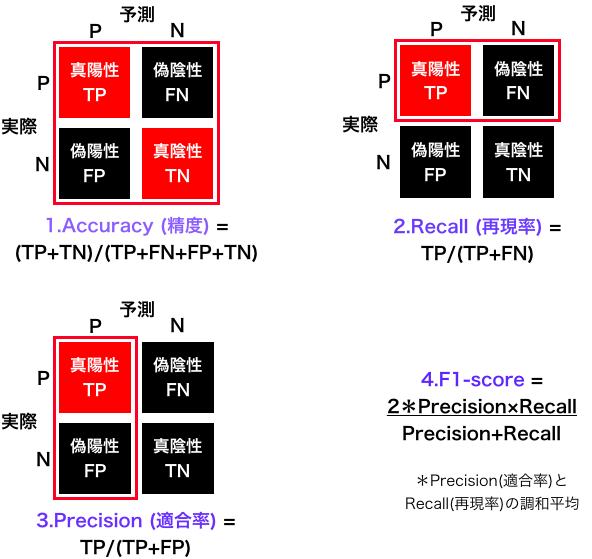
4つの指標を表示するコードです。今回のデータセットは、0がガン患者、1を正常者なので、recall, precision, f1-score の引数に pos_label=0 を加えています。
# ------- accuracy, precision, recall, f1_score for test_data------
from sklearn.metrics import precision_score
from sklearn.metrics import recall_score
from sklearn.metrics import f1_score

scores = {}
for pipe_name, pipeline in pipelines.items():
    scores[(pipe_name,'1.accuracy')] = accuracy_score(y_test, pipeline.predict(X_test))
    scores[(pipe_name,'2.recall')] = recall_score(y_test, pipeline.predict(X_test), pos_label=0)
    scores[(pipe_name,'3.precision')] = precision_score(y_test, pipeline.predict(X_test), pos_label=0)
    scores[(pipe_name,'4.f1_score')] = f1_score(y_test, pipeline.predict(X_test), pos_label=0)
print(pd.Series(scores).unstack())
この比較で言えば、まずなんと言ってもガン患者を正常者として間違えることが少ない(recallが高い)2〜4が候補で、その中で正常者をガン患者と間違えることも少ない(precisionが高い)、2.Logistic が最も良いと思われます。
7.ROC曲線、AUC
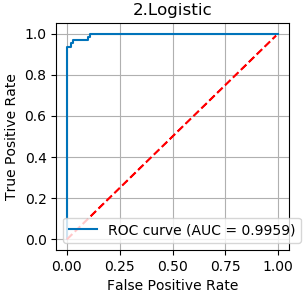
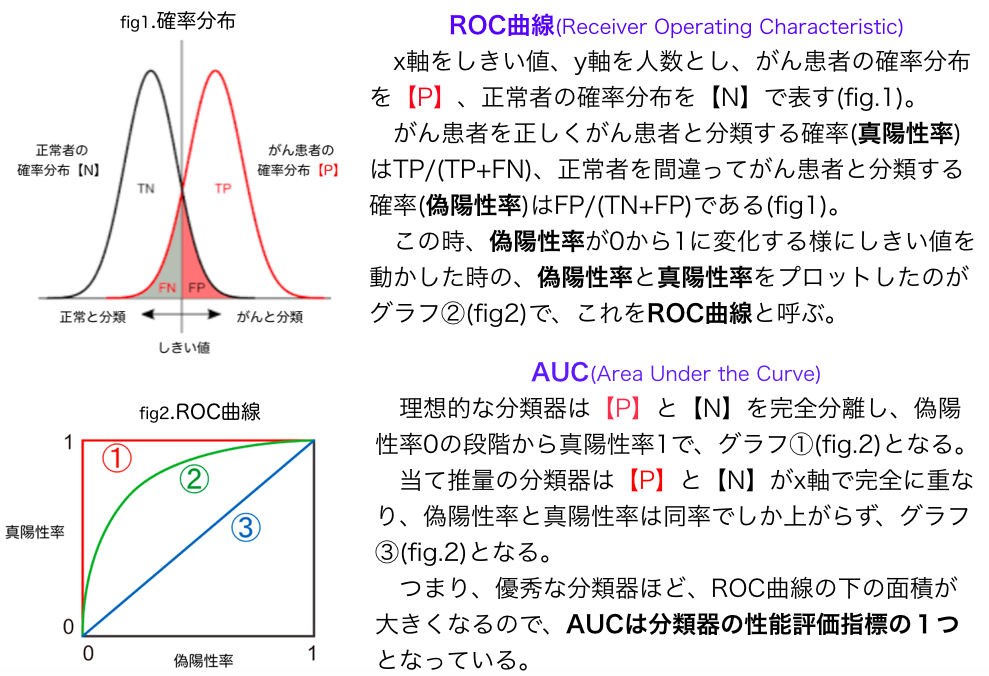
最初に、ROC曲線とAUCについて、具体的な例を上げて説明します。
# -------- ROC曲線, AUC -----------
for pipe_name, pipeline in pipelines.items():
    fpr, tpr, thresholds = metrics.roc_curve(y_test, pipeline.predict_proba(X_test)[:, 0], pos_label=0) # 0:ガン患者の分類
    auc = metrics.auc(fpr, tpr)
    plt.figure(figsize=(3, 3), dpi=100)
    plt.plot(fpr, tpr, label='ROC curve (AUC = %.4f)'%auc)
    x = np.arange(0, 1, 0.01)
    plt.plot(x, x, c = 'red', linestyle = '--')
    plt.legend()
    plt.title(pipe_name)
    plt.xlabel('False Positive Rate')
    plt.ylabel('True Positive Rate')
    plt.grid(True)
    plt.show()
コードの出力は8つですが、代表として、2.Lostic の ROC曲線とAUC をみるとかなり理想の分類精度に近いことが分かります。
