はじめに
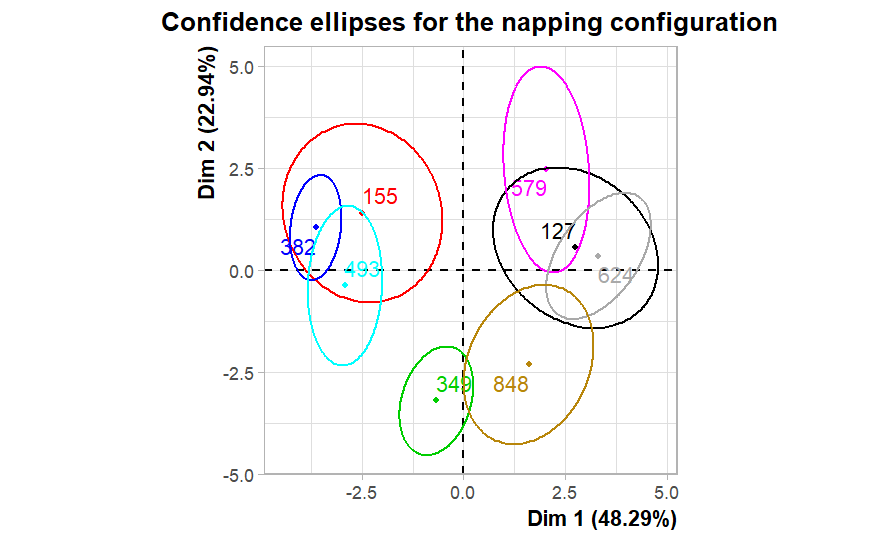
食品の官能評価の手法の一つに、サンプル間の類似度を使用するNappingがあります。この手法により、各パネルの結果を統合して、サンプル間の類似関係を評価することができます。Napping実施には、紙と定規を使用するなどしてサンプルの座標を取得する必要がありますが、パネル数が増加するごとに手間が増えます。そのため、多くの会社PCに導入されているPowerPoint ファイルを使用して座標を取得し、csv に出力するスクリプトをpython で実装します。
実装
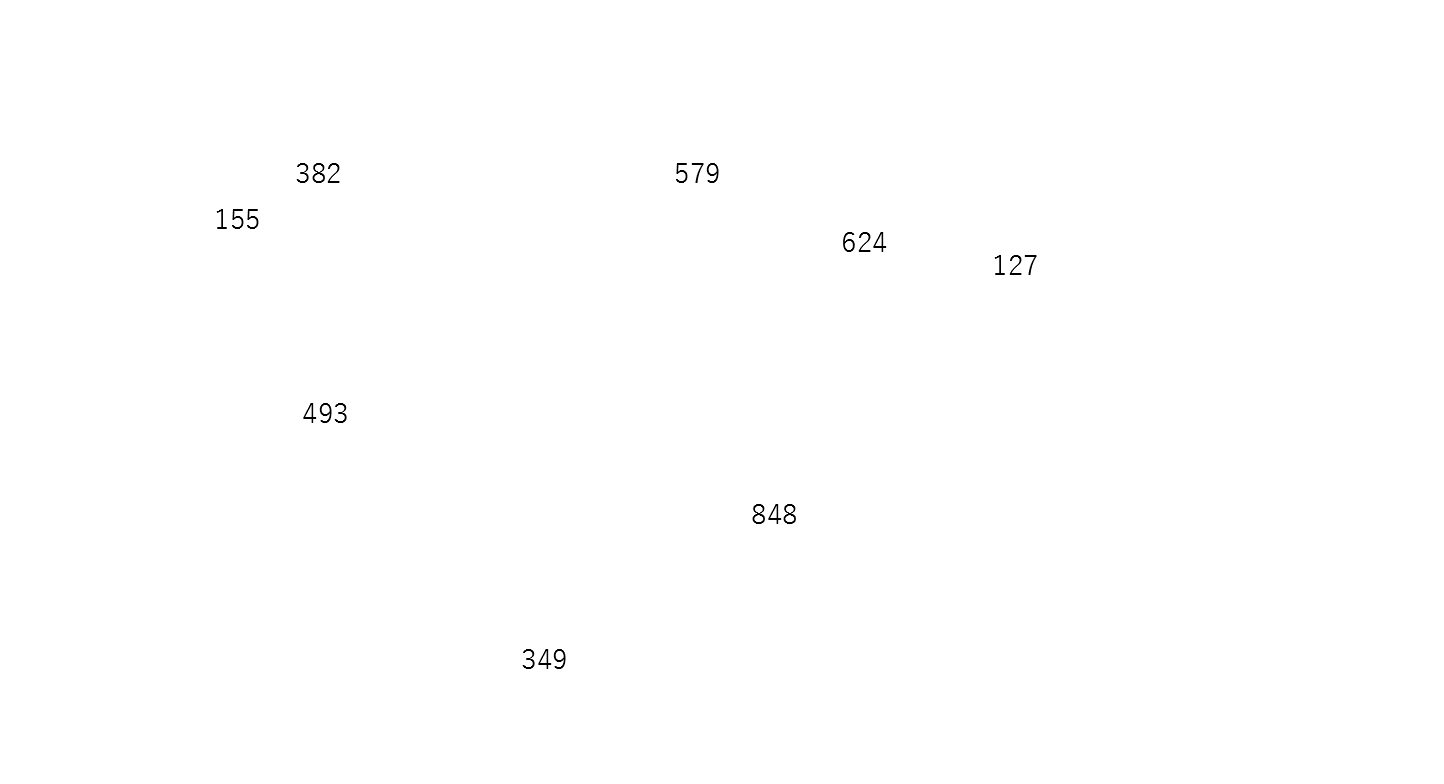
以下のようなテキストボックスが配置されたpptx を使用します。各パネルにpptx を記入してもらい、glob python-pptxモジュールでまとめて処理します。
import pandas as pd
import glob
import os
from pptx import Presentation

# make dictionary
coordinates_by_index = {}

# file look up
root_path = r"" # your directory path
files_pptx = glob.glob(root_path + "/*pptx")

for file in files_pptx:
    presentation = Presentation(file)
    slides = presentation.slides[0]
    for shape in slide.shapes:
    text =  shape.text
    # set coordinates
    x = shape.left + shape.width/2
    y = shape.top + shape.height/2

    if text not in coordinates_by_index:
        coordinates_by_index[text] = []

    coordinates_by_index[text].append([x,y])

# store by pandas
df_napping = pd.DataFrame(coordinates_by_index).T
columns_napping = [f"{x}" for x in range(len(df_napping.columns))]
df_napping.columns = columns_napping

# split columns by x,y coordinates
def split_columns(df):
    new_columns = []
    for col in df.columns:
        list_coord = ["X", "Y"]
        for i, coord in enumerate(list_coord):
            new_col_name = f'{coord}_{col}'
            df[new_col_name] = df[col].apply(lambda x: x[i])
        new_columns.extend([f'{coord}_{col}' for coord in list_coord])

    df = df[new_columns]
    return df

df_napping_split = split_columns(df_napping)
df_napping_split.to_csv(root_path+"\preprocessed_napping.csv")
R による Napping 解析
R に SensoMineR パッケージがあるため、それを利用して Napping® 解析をします。
# import library
library(SensoMineR)
library(MASS)

# read csv
data_raw = read.csv("preprocessed_napping.csv",header = T, fileEncoding= "Shift-JIS")

# panel size
panel_size = 10
# trim_raw_dataframe
data_nap_ufp = data_raw[1:nrow(data_raw), 2:ncol(data_raw)]
rownames(data_nap_ufp) = data_raw[,1]

# extract napping data from ufp dataframe
data_napping = data_nap_ufp[,1:(panel_size*2)]
##data_napping_autoscaled = scale(data_napping)

dev.new()
# obtain max value
coord_x_max = max(data_napping[, seq(1, ncol(data_napping), by = 2)])
coord_y_max = max(data_napping[, seq(2, ncol(data_napping), by = 2)])

# visualize raw coordinates
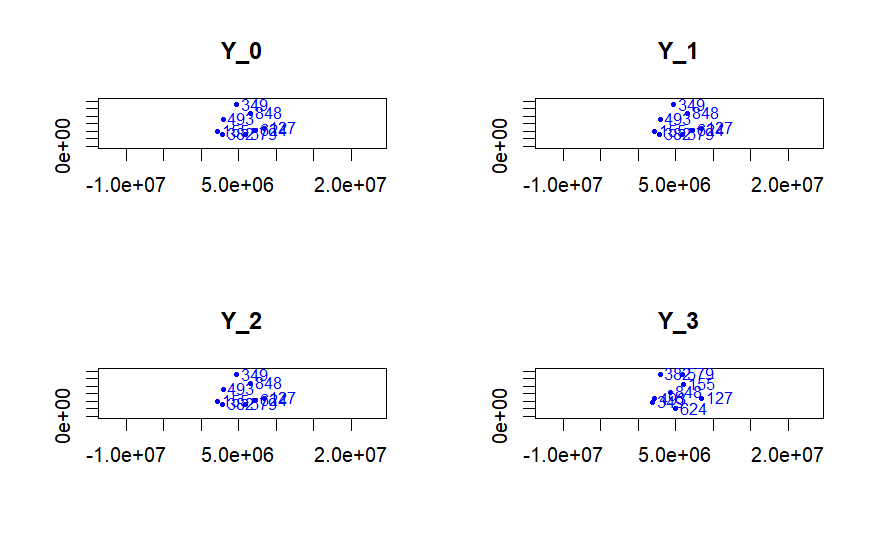
nappeplot(data_napping, lim = c(coord_x_max*1.1 , coord_y_max*1.1))
# show product mappping
data_mfa = pmfa(data_napping, lim = c(coord_x_max * 1.1, coord_y_max * 1.1))
data_mfa_2 = boot(data_napping, method = "napping")
# show RV coefficient
RV = data_mfa$MFA$group$RV
barplot(RV[1:nrow(RV)-1, ncol(RV)], ylim = c(0,1), axis.lty  = 1, las = 3, main = "RV coefficient / mean")
エラー(20240818時点)
Napping データとCATAデータを組み合わせてpmfa関数で処理しようとすると、以下のようなエラーに直面します。
if (c("quanti", "mixed") %in% res.mfa$call$nature.var) L <- list(x = "topleft", でエラー: the condition has length > 1
Rのpmfa関数の基となっているコードらしきURLを確認してみると、以下のコードがエラーを吐いていることがわかりました。
print(plot(res.afm,choix="var",invisible="quanti",axes=coord,new.plot=TRUE))
上記のコードは可視化にCATAデータのみを用いた可視化に使用され、解析に直接関係するわけではないため、コメントアウトすることで、Napping® データとCATAデータを用いた解析が可能です。
# raw code from https://rdrr.io/cran/SensoMineR/src/R/pmfa.R
pmfa<-function (matrice, matrice.illu = NULL, mean.conf = NULL, dilat = TRUE,
    graph.ind = TRUE, graph.mfa = TRUE, lim = c(60, 40), coord = c(1, 2), cex = 0.8)
{
    procrustes <- function(amat, target, orthogonal = FALSE, translate = FALSE,
        magnify = FALSE) {
        for (i in nrow(amat):1) {
            if (any(is.na(amat)[i, ]) | any(is.na(target)[i,
                ])) {
                amat <- amat[-i, ]
                target <- target[-i, ]
            }
        }
        dA <- dim(amat)
        dX <- dim(target)
        if (length(dA) != 2 || length(dX) != 2)
            stop("arguments amat and target must be matrices")
        if (any(dA != dX))
            stop("dimensions of amat and target must match")
        if (length(attr(amat, "tmat")))
            stop("oblique loadings matrix not allowed for amat")
        if (orthogonal) {
            if (translate) {
                p <- dX[1]
                target.m <- (rep(1/p, p) %*% target)[, ]
                amat.m <- (rep(1/p, p) %*% amat)[, ]
                target.c <- scale(target, center = target.m,
                  scale = FALSE)
                amat.c <- scale(amat, center = amat.m, scale = FALSE)
                j <- svd(crossprod(target.c, amat.c))
            }
            else {
                amat.c <- amat
                j <- svd(crossprod(target, amat))
            }
            rot <- j$v %*% t(j$u)
            if (magnify)
                beta <- sum(j$d)/sum(amat.c^2)
            else beta <- 1
            B <- beta * amat.c %*% rot
            if (translate)
                B <- B + rep(as.vector(target.m), rep.int(p,
                  dX[2]))
            value <- list(rmat = B, tmat = rot, magnify = beta)
            if (translate)
                value$translate <- target.m - (rot %*% amat.m)[,
                  ]
        }
        else {
            b <- solve(amat, target)
            gamma <- sqrt(diag(solve(crossprod(b))))
            rot <- b * rep(gamma, rep.int(dim(b)[1], length(gamma)))
            B <- amat %*% rot
            fcor <- solve(crossprod(rot))
            value <- list(rmat = B, tmat = rot, correlation = fcor)
        }
        value
    }
 #------------------------------------------------------------------------------

    nbjuge <- ncol(matrice)/2
    matricemoyenne<-colMeans(matrice)
    matrice <- scale(matrice, center = TRUE, scale = FALSE)
    if (!is.null(matrice.illu)) matrice.illu = matrice.illu[rownames(matrice),]
    do.mfa = FALSE
    if (is.null(mean.conf)) {
        do.mfa = TRUE
        if (is.null(matrice.illu)) res.afm <- MFA(as.data.frame(matrice), group = rep(2, nbjuge), ncp = max(coord),type=rep("c",nbjuge),graph=FALSE)
        else res.afm <- MFA(cbind.data.frame(matrice,matrice.illu), group = c(rep(2, nbjuge),ncol(matrice.illu)), ncp = max(coord),type=c(rep("c",nbjuge),"s"),num.group.sup = nbjuge+1,graph=FALSE)
        mean.conf <- res.afm$ind$coord
    }
    mean.conf <- as.matrix(mean.conf[, coord])
    res <- matrix(0, nbjuge, 1)
 #-----------------------------------------------------------------------------#
    for (j in 1:nbjuge) {
        atourner <- as.matrix(matrice[, (2 * (j - 1) + 1):(2 *
            j)])
        if ((dilat == TRUE) & (do.mfa == TRUE)) {
            eig <- eigen(1/nrow(atourner) * t(scale(atourner,scale=FALSE)) %*% scale(atourner,scale=FALSE))
            res.procrustes <- procrustes(atourner, mean.conf,
                orthogonal = TRUE, translate = TRUE, magnify = FALSE)
            magnify <- sqrt(res.afm$eig[1,1])/sqrt(eig$values[1])
        }
        else {
            res.procrustes <- procrustes(atourner, mean.conf,
                orthogonal = TRUE, translate = TRUE, magnify = TRUE)
            magnify <- res.procrustes$magnify
        }
        tourne <- scale(atourner,scale=FALSE) %*% res.procrustes$tmat * magnify
        res[j] <- coeffRV(mean.conf, tourne)$rv
        if (graph.ind == TRUE) {
            dd = cbind(mean.conf, tourne)
            nappe <- rbind((matrix(c(0, 0, 0, lim[2], lim[1], lim[2], lim[1], 0),ncol=2,byrow = TRUE)
                        -cbind(rep( matricemoyenne[(2 * (j - 1) + 1)],4),rep( matricemoyenne[(2 * j)],4))) %*% res.procrustes$tmat * magnify)


            if (j != 1)
            if (!nzchar(Sys.getenv("RSTUDIO_USER_IDENTITY"))) dev.new()
            plot(rbind(tourne, mean.conf, nappe), type = "n",
                xlab = paste("Dim", coord[1]), ylab = paste("Dim",
                  coord[2]), asp = 1, main = colnames(matrice)[2 *
                  j], sub = paste("RV between the mean representation and the representation of",
                  colnames(matrice)[2 * j], ": ", signif(res[j], 4)), cex.sub = cex)
            for (i in 1:nrow(mean.conf)) points(mean.conf[i, 1], mean.conf[i, 2], cex = cex, pch = 20)
            for (i in 1:nrow(mean.conf)) text(mean.conf[i, 1], mean.conf[i, 2], rownames(matrice)[i], cex = cex,
                pos = 1, offset = 0.5)
            lines(nappe[c(1:4, 1), ], col = 3, lty = 2)
            for (i in 1:nrow(mean.conf)) points(tourne[i, 1],  tourne[i, 2], cex = cex, pch = 20, col = 3)
            for (i in 1:nrow(mean.conf)) text(tourne[i, 1], tourne[i, 2], rownames(matrice)[i], col = 3, font = 3,
                cex = cex, pos = 2, offset = 0.2)
        }
    }
    if (do.mfa&graph.mfa){
      print(plot(res.afm,choix="var",axes=coord,new.plot=TRUE))
      if (!is.null(matrice.illu)){
        print(plot(res.afm,choix="var",invisible="quanti.sup",axes=coord,new.plot=TRUE))
        # 20240725: comment out the code below, don't show cata/rata result
        #print(plot(res.afm,choix="var",invisible="quanti",axes=coord,new.plot=TRUE))
      }
      print(plot(res.afm,choix="ind",partial="all",habillage="group",axes=coord,new.plot=TRUE))
      print(plot(res.afm,choix="ind",habillage="none",axes=coord,new.plot=TRUE))
      print(plot(res.afm,choix="group",axes=coord,new.plot=TRUE))
    }
    res <- list(RV = colnames(matrice)[(1:(ncol(matrice)/2)) * 2], "RV coeff", MFA=res.afm)
    return(res)
おわりに
違っている点など見つかれば適宜修正します。どなたかの役に立てば幸いです。


