はじめに
食品の官能評価において、咀嚼中に感じる特定の味の強度推移を測定する手法にTime Intensity (TI) 法があります。行うことはとてもシンプルで、iPad などを用いてスケールバーを動かすことで、自分が感じている官能強度を経時的に示します。
行うことがシンプルであることと、複数人で同時に評価を行いたかったため、Python で実装しました。取得したデータはcsv で出力されます。ついでにリアルタイムでカーブを確認できるようにしました。
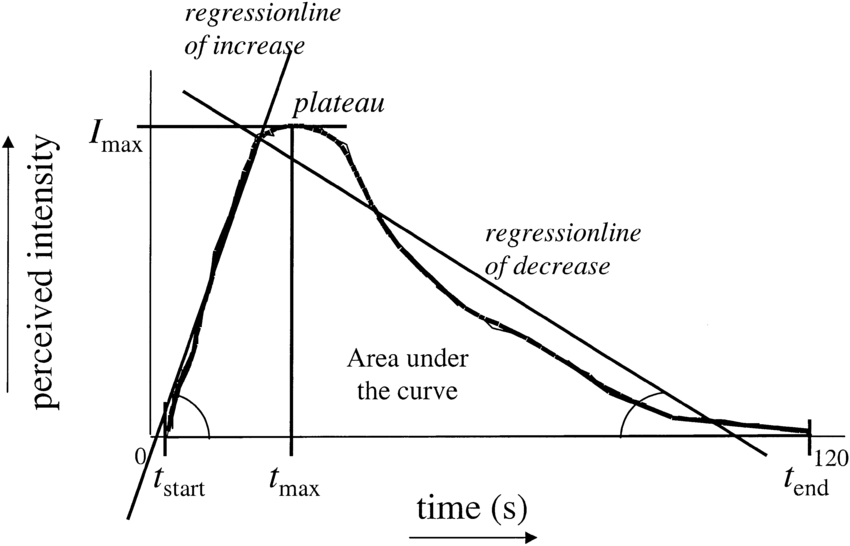
TI curve イメージ
参考文献
実装
TI curve の取得
TI Data Plotter の定義
import tkinter as tk
import numpy as np
import matplotlib.pyplot as plt
from matplotlib.backends.backend_tkagg import FigureCanvasTkAgg
import matplotlib.animation as animation
import time

class TIDataPlotter:
    def __init__(self, master):
        self.master = master
        self.master.title("T-I Data Plotter")
        self.master.geometry('800x600') # window size

        # Create a canvas for the plot
        self.fig, self.ax = plt.subplots()
        self.canvas = FigureCanvasTkAgg(self.fig, master=self.master)
        self.canvas.get_tk_widget().pack(fill=tk.BOTH, expand=True)

        # Initialize the plot and data arrays
        self.xdata, self.ydata = [], []
        self.ln, = self.ax.plot([], [], 'b-')

        # Create "Start" and "End" buttons for measuring T-I values
        self.start_button = tk.Button(self.master, text="Start", command=self.start_measurement, width=10, height=5)
        self.start_button.pack(side=tk.LEFT, padx=5)
        self.end_button = tk.Button(self.master, text="End", command=self.end_measurement, state=tk.DISABLED, width =10, height =5)
        self.end_button.pack(side=tk.LEFT, padx = 5)

        # Create a Scale widget for setting the T-I value
        self.ti_value = tk.DoubleVar()
        self.ti_scale = tk.Scale(self.master, from_=0.0, to=100.0, variable=self.ti_value, resolution=0.01, orient=tk.HORIZONTAL,length=400)
        self.ti_scale.pack(side=tk.LEFT)

        # Create a label for displaying the current T-I value
        tk.Label(self.master, text="T-I Value:").pack(side=tk.TOP)
        self.ti_label = tk.Label(self.master, text="N/A", font=("bold"))
        self.ti_label.pack(side=tk.TOP)

         # Create a label for displaying the measurement time
        tk.Label(self.master, text="Measurement Time:").pack(side=tk.TOP)
        self.time_label = tk.Label(self.master, text="0:00:00", font=("bold"))
        self.time_label.pack(side=tk.TOP)


        # Initialize the measurement state variables
        self.measurement_running = False
        self.measurement_start_time = None
        self.measurement_duration = 10.0

        # Continuously update the label and plot with the current T-I value
        self.anim_running = True
        self.anim = animation.FuncAnimation(self.fig, self.update_plot, interval=50)
        self.update_tivalue()


    def update_plot(self, frame):
        # Get the current T-I value
        ti_value = self.ti_value.get()

        # Append the current time and T-I value to the data arrays during a measurement
        if self.measurement_running:
            # 20240804 revised to get precise time: from time.time() to time.perf_counter()
            self.xdata.append(time.perf_counter() - self.measurement_start_time)
            self.ydata.append(ti_value)

        # Update the plot with the new data
        self.ln.set_data(self.xdata, self.ydata)
        self.ax.relim()
        self.ax.autoscale_view()
        self.ax.set_ylim(0, 100) #restriction scale y
        self.canvas.draw()

         # Update the measurement time label
        if self.measurement_running:
            # 20240804 revised to get precise time: from time.time() to time.perf_counter()
            elapsed_time = time.perf_counter() - self.measurement_start_time
            formatted_time = time.strftime("%H:%M:%S", time.gmtime(elapsed_time))
            self.time_label.config(text=formatted_time)

    def update_tivalue(self):
        # Get the current T-I value and update the label
        ti_value = self.ti_value.get()
        self.ti_label.config(text="{:.2f}".format(ti_value))

        if self.anim_running:
            # Schedule the next update
            self.master.after(100, self.update_tivalue)

    def start_measurement(self):
        # Set the measurement state variables
        self.measurement_running = True
        # 20240804 revised to get precise time: from time.time() to time.perf_counter()
        self.measurement_start_time = time.perf_counter()
        self.xdata, self.ydata = [], []

        # Disable the "Start" button and enable the "End" button
        self.start_button.config(state=tk.DISABLED)
        self.end_button.config(state=tk.NORMAL)
    def end_measurement(self):
        # Set the measurement state variables
        self.measurement_running = False

        # Enable the "Start" button and disable the "End" button
        self.start_button.config(state=tk.NORMAL)
        self.end_button.config(state=tk.DISABLED)
         # Save the measurement data to a CSV file
        #self.anim.save("test.gif", writer = 'imagemagick')
        filename = "measurement_data.csv"
        with open(filename, "w") as f:
            # Write the header
            f.write("Time,TI Value\n")

            # Write the data
            for x, y in zip(self.xdata, self.ydata):
                # 20240804 added to adjust tare
                x_init = self.xdata[0]
                f.write("{:.3f},{:.3f}\n".format(x - x_init, y))
TI Data Plotter の実行
if __name__ == '__main__':
    # Create the Tkinter application and TIDataPlotter window
    root = tk.Tk()
    ti_data_plotter = TIDataPlotter(root)

    # Run the Tkinter application
    root.mainloop()
TI curve の解析
ライブラリインポート
import os
import glob
import pprint
#ROOT_PATH = r"D"
import matplotlib.pyplot as plt
from sklearn import metrics
import numpy as np
import pandas as pd
lookup_file = glob.glob("*csv*")
print(lookup_file)
出力ファイルのカーブよりパラメーターを算出
%matplotlib inline
ls_auc= []
ls_Iarea= []
ls_Darea= []
ls_Tmax= []
ls_Imax= []
ls_duration= []
index=[]


for i in range(len(lookup_file)):
    df= pd.read_csv(lookup_file[i], header= 0,  encoding="shift-jis")
    df=df.iloc[:,0:2]
    time = df.iloc[:,0]
    intensity = df.iloc[:,1]
    pred_duration  = df[df.iloc[:,1]>0]
    duration =pred_duration.iloc[:,0]
    min_dur =duration.min()
    max_dur =duration.max()
    duration=max_dur-min_dur
    max_index =intensity.argmax()
    max_time = df.iloc[max_index,0]


    print("===========",lookup_file[i],"==========")
    print("whole auc:",metrics.auc(time, intensity))
    print("I area:", metrics.auc(df.iloc[:max_index+1,0], df.iloc[:max_index+1,1]))
    print("D area:", metrics.auc(df.iloc[max_index:,0], df.iloc[max_index:,1]))
    print("T max(sec):", max_time)
    print("I max(intensity):", intensity.max())
    print("duration(sec):", duration)

    ls_auc.append(metrics.auc(time, intensity))
    ls_Iarea.append(metrics.auc(df.iloc[:max_index+1,0], df.iloc[:max_index+1,1]))
    ls_Darea.append(metrics.auc(df.iloc[max_index:,0], df.iloc[max_index:,1]))
    ls_Tmax.append(max_time)
    ls_Imax.append(intensity.max())
    ls_duration.append(duration)
    index.append(lookup_file[i])
出力をDataFrame へ格納
df_sum =pd.DataFrame({"auc":ls_auc,
                     "I area":ls_Iarea,
                     "D area":ls_Darea,
                     "T max(sec)":ls_Tmax,
                     "I max(intensity)":ls_Imax,
                     "duration(sec)":ls_duration},index= index)
追記(20240804)
コード修正
-
timeモジュールの変更
より測定時間誤差が小さいtime.perf_counter()に変更
# pre-revision
time.time()
# 20240804 revised to get precise time
time.perf_counter()
- 初期測定時間の修正
初期測定時間のゼロ点合わせができていなかったため、コードを追加
filename = "measurement_data.csv"
with open(filename, "w") as f:
    # Write the header
    f.write("Time,TI Value\n")

    # Write the data
    for x, y in zip(self.xdata, self.ydata):
        # 20240804 added to adjust tare
        x_init = self.xdata[0]
        f.write("{:.3f},{:.3f}\n".format(x - x_init, y)
バリデーション
バリデーションコード
# validation code
# library import & obtain files name
import glob
import matplotlib.pyplot as plt
import numpy as np
import pandas as pd
files =  glob.glob("*.csv")
files
# sample size
n = 5
# mean: each time points
mean = []
# standard deviation: each time points
sd = []
# coefficient of variation: each time points
cv = []


for file in files:

    df = pd.read_csv(file)

    interval = []
    data_time = df.iloc[:,0]
    # get diff
    for i in range(1,len(data_time)):
        interval.append(data_time[i]- data_time[i-1])
    # visualization
    plt.hist(np.array(interval).flatten(), bins = 50)
    plt.xlabel("time_interval (sec)")
    plt.ylabel("count")
    plt.title(f"{file}")
    plt.savefig(f"{file}_hist.png")
    plt.show()

    mean.append(np.mean(interval))
    sd.append(np.std(interval))

    cv.append(np.std(interval)/np.mean(interval))

# calc SD between measurements
std_each_evaluation = []
for i in range(0,len(mean), n):
    std_each_evaluation.append(np.std(mean[i:i+5]))
print(std_each_evaluation)
1. time モジュールの選択
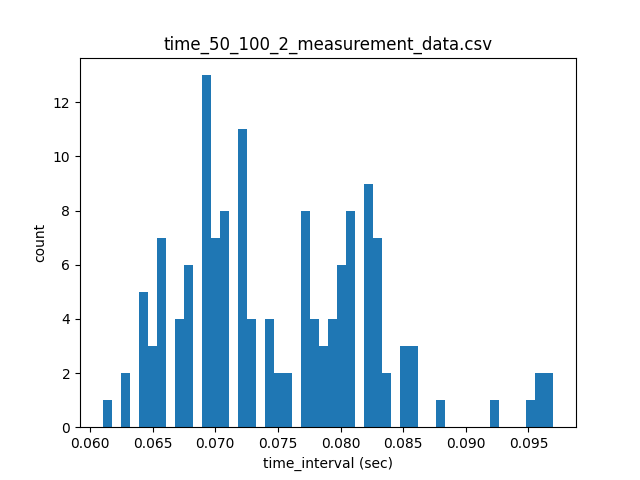
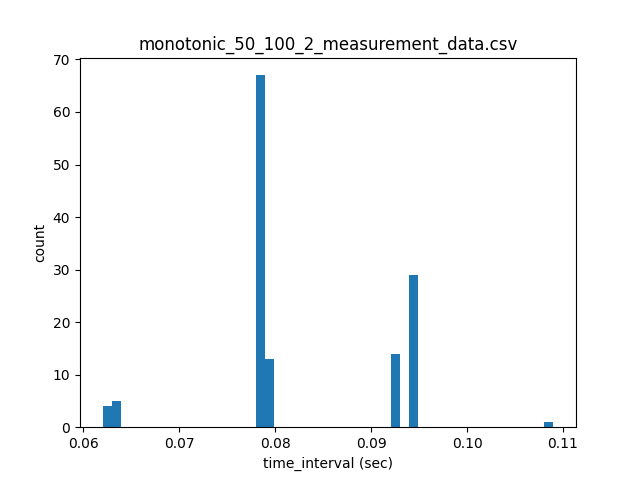
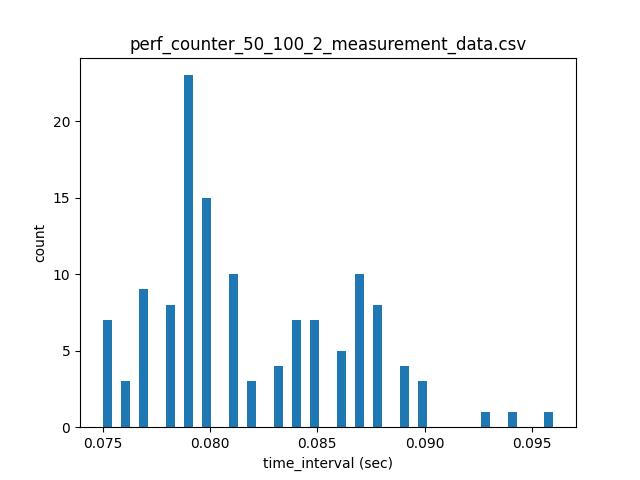
time モジュールには time.time() のほかに、後戻りしないクロックの値を返す time.monotonic() 、より高い時間分解能をもつ time.perf_counter() などのモジュールがあります。以下のパラメーターの時のtimeモジュールの違いによる測定点間隔 (sec) を比較します。 (試行回数: n=5)
self.anim = animation.FuncAnimation(self.fig, self.update_plot, interval=50)self.master.after(100, self.update_tivalue)
平均値、標準偏差、変動係数、測定点間隔平均値の試行間誤差 (n=5)
| 1 | 2 | 3 | 4 | 5 | |
|---|---|---|---|---|---|
| 平均値 | 0.0759 | 0.0752 | 0.0759 | 0.0754 | 0.0758 |
| 標準偏差 | 0.0078 | 0.0077 | 0.0071 | 0.007 | 0.0064 |
| 変動係数 | 0.1028 | 0.1022 | 0.0932 | 0.0934 | 0.0845 |
| 標準偏差(試行間) | 0.0003 |
平均値、標準偏差、変動係数、測定点間隔平均値の試行間誤差 (n=5)
| 1 | 2 | 3 | 4 | 5 | |
|---|---|---|---|---|---|
| 平均値 | 0.0804 | 0.0824 | 0.0811 | 0.0821 | 0.0817 |
| 標準偏差 | 0.0076 | 0.0092 | 0.0081 | 0.0083 | 0.0094 |
| 変動係数 | 0.0943 | 0.1113 | 0.1005 | 0.1012 | 0.1146 |
| 標準偏差(試行間) | 0.00069 |
平均値、標準偏差、変動係数、測定点間隔平均値の試行間誤差 (n=5)
| 1 | 2 | 3 | 4 | 5 | |
|---|---|---|---|---|---|
| 平均値 | 0.0821 | 0.0819 | 0.0821 | 0.0817 | 0.0823 |
| 標準偏差 | 0.0038 | 0.0045 | 0.0041 | 0.0039 | 0.0041 |
| 変動係数 | 0.0465 | 0.0552 | 0.0494 | 0.0478 | 0.05 |
| 標準偏差(試行間) | 0.00019 |
上記の結果から、変動係数の低いtime.perf_counter()を選択します。
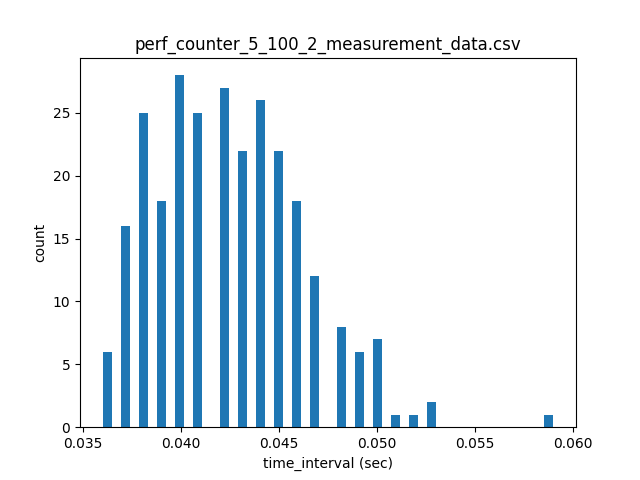
2. 測定点間隔
測定点間隔は以下のコードのinterval = 50を書き換えることで変更可能です。
測定点間隔を変更した際の測定点間隔平均値、標準偏差、変動係数、測定点間隔平均値の試行間誤差 (n=5)を記載します。
self.anim = animation.FuncAnimation(self.fig, self.update_plot, interval=50)
平均値、標準偏差、変動係数、測定点間隔平均値の試行間誤差 (n=5)
| 1 | 2 | 3 | 4 | 5 | |
|---|---|---|---|---|---|
| 平均値 | 0.0425 | 0.0425 | 0.0428 | 0.0421 | 0.0429 |
| 標準偏差 | 0.0032 | 0.0038 | 0.004 | 0.0035 | 0.004 |
| 変動係数 | 0.0754 | 0.0895 | 0.0923 | 0.0837 | 0.093 |
| 標準偏差(試行間) | 0.00029 |
平均値、標準偏差、変動係数、測定点間隔平均値の試行間誤差 (n=5)
| 1 | 2 | 3 | 4 | 5 | |
|---|---|---|---|---|---|
| 平均値 | 0.5269 | 0.5281 | 0.5276 | 0.5253 | 0.5272 |
| 標準偏差 | 0.0072 | 0.005 | 0.0059 | 0.0052 | 0.0045 |
| 変動係数 | 0.0137 | 0.0094 | 0.0111 | 0.0099 | 0.0085 |
| 標準偏差(試行間) | 0.00095 |
さいごに
解析方法、評価指標などは自由にいじれます。どなたかのお役に立てれば幸いです。
