enebularのINFOMOTION Typeはプラグイン化されていて独自に拡張も可能ですが、まずは標準のINFOMOTION Typeの使い方を見ていきます。
初歩デモ準備
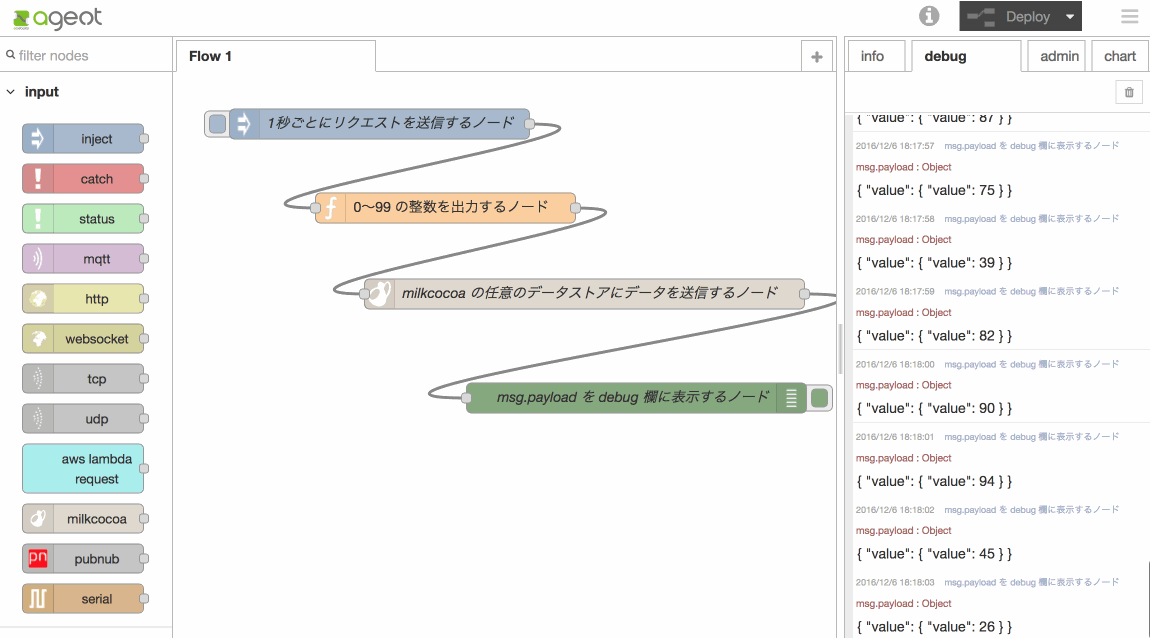
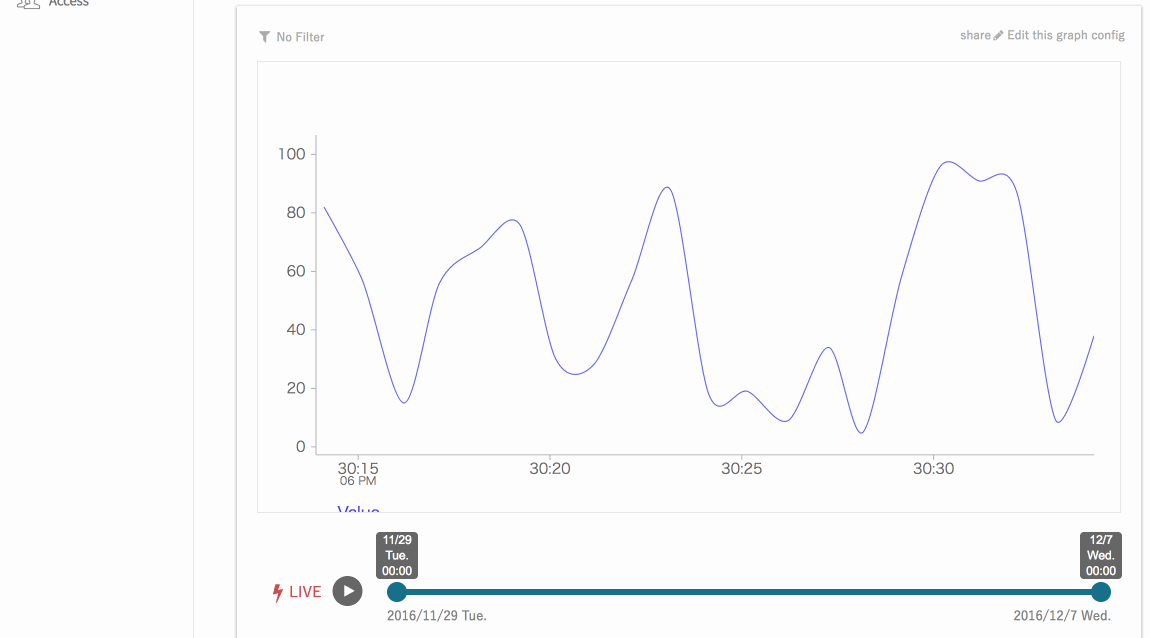
enebular Advent Calendar 2016初日の@satton_maroyakaのエントリ、enebularをつかいはじめるにあるスライドを見て準備すると以下のようになります。
今回は標準INFOMOTION TypeのPieChartとValueRangePieChart用にランダム発生データを少し変更します。Functionノードを開いて以下のように変更します。
msg.payload = {
    id : "value" + Math.floor(Math.random() * 5),
    value : Math.floor(Math.random() * 100)
};
return msg;
PieChart
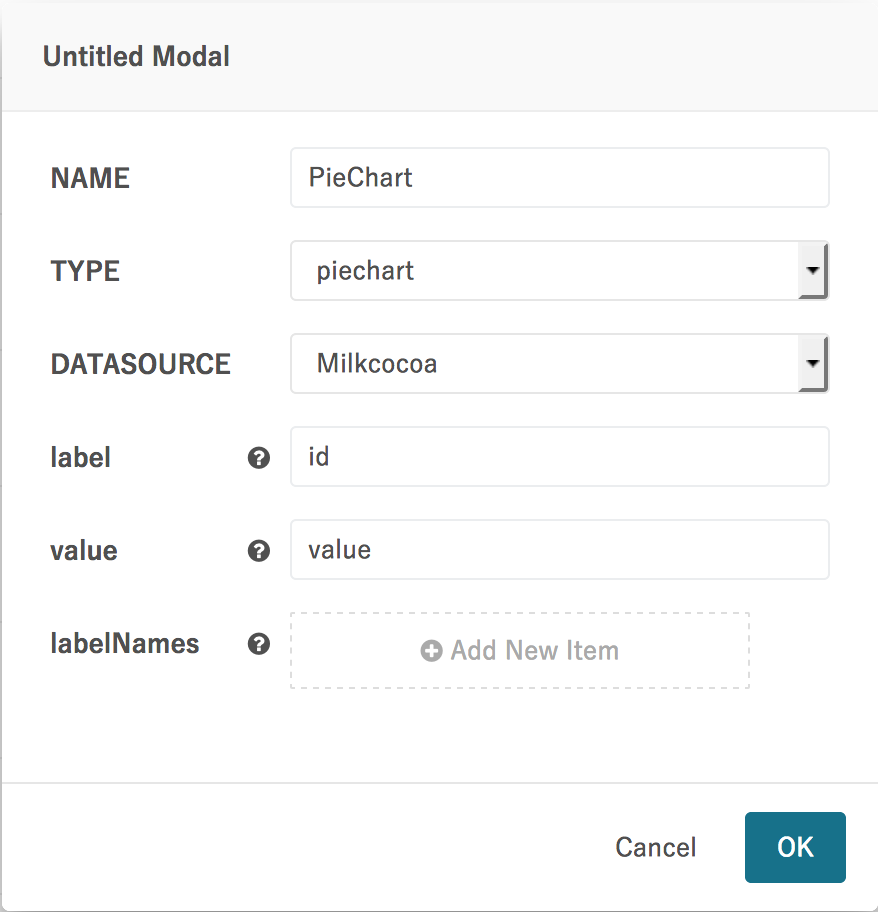
INFOMOTIONのCreate Graphで以下のような設定でPieChartを作成します。
これをLiveモードで開くと以下のようになります。
ValueRangePieChart
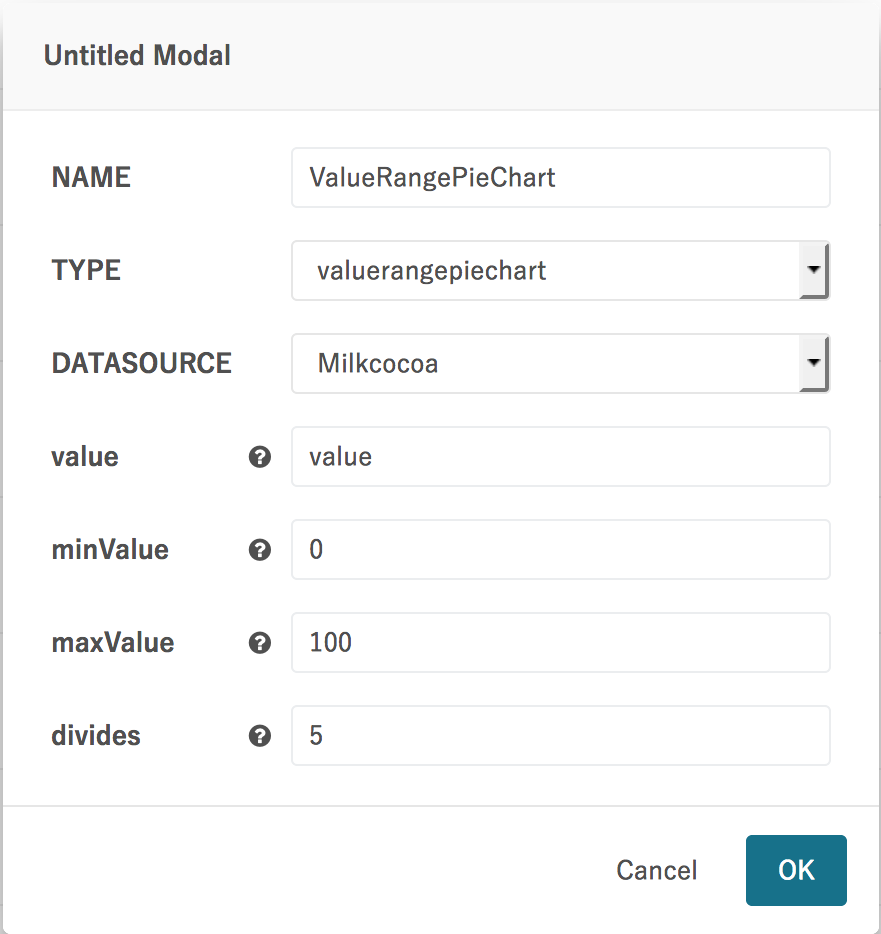
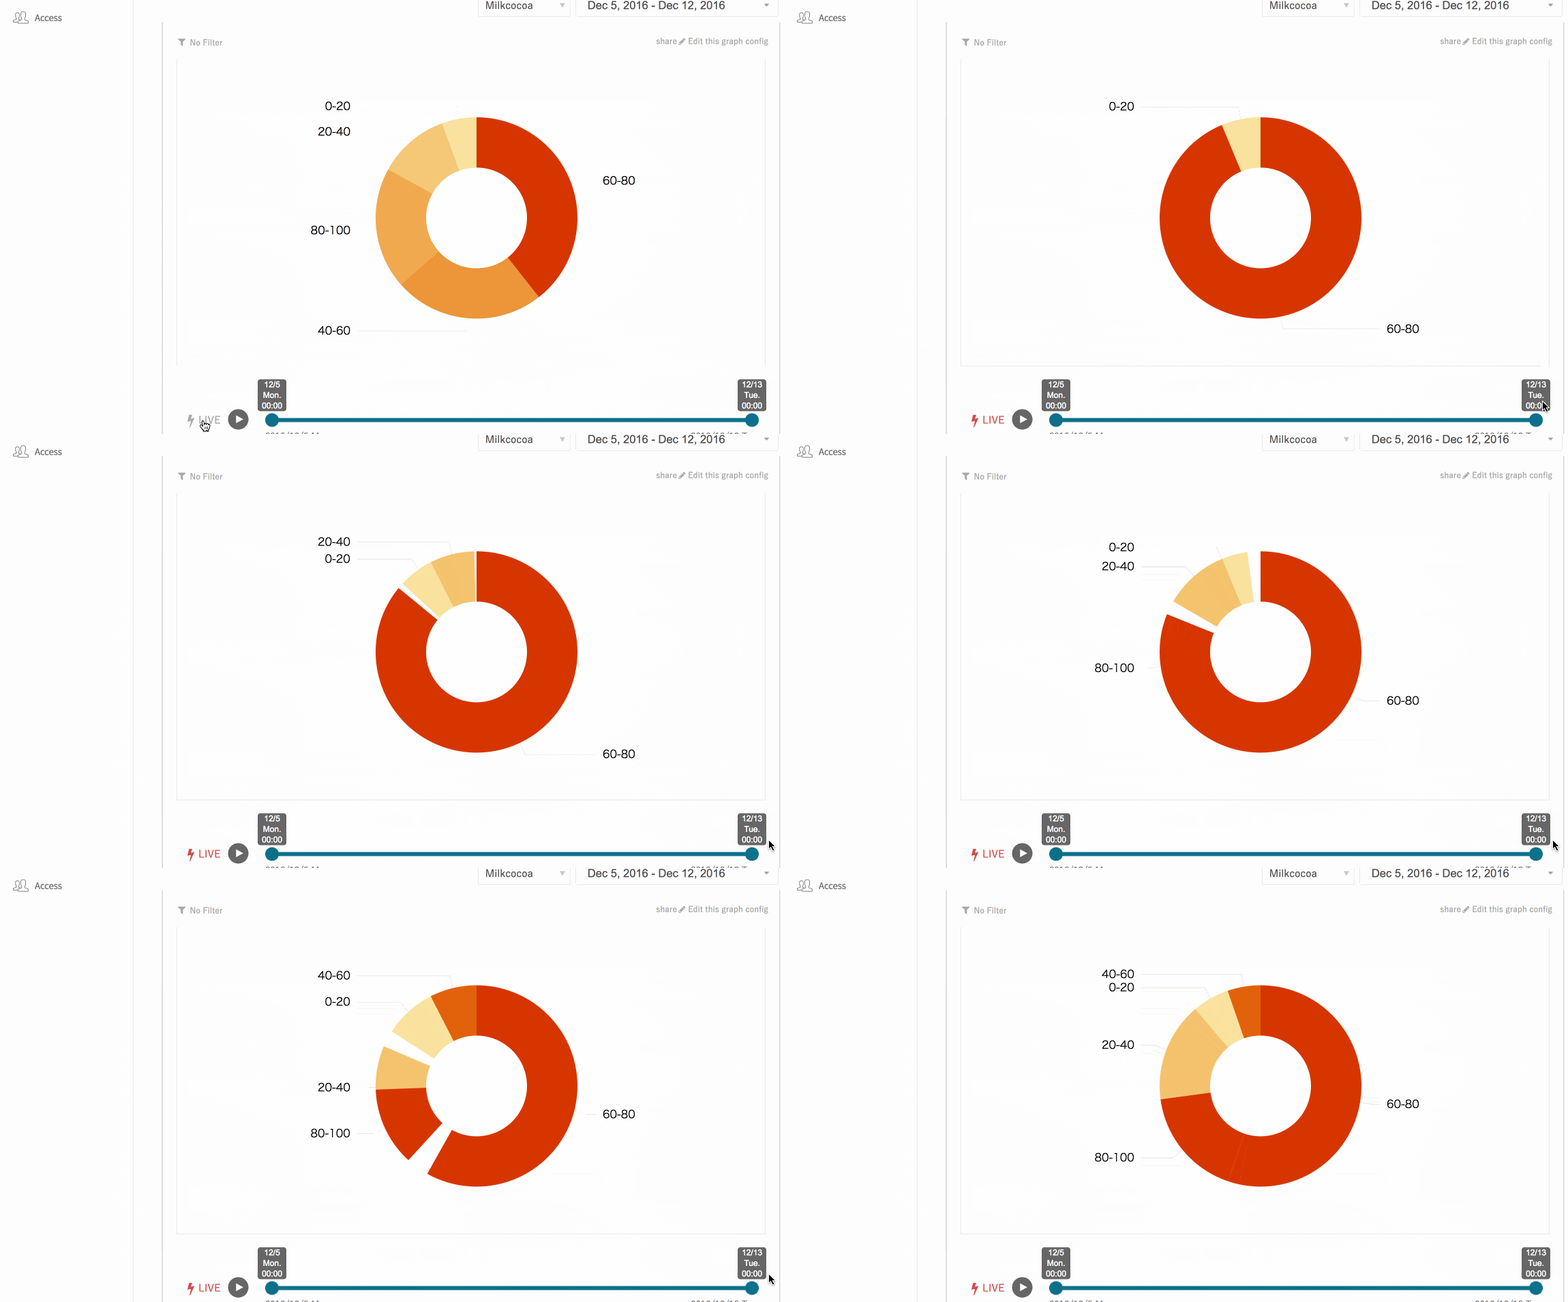
ValueRangePieChartとは送信されるデータの値を、例えば0〜20,20〜40,40〜60...のような範囲でカウントするためのINFOMOTION Typeです。
INFOMOTIONのCreate Graphで以下のような設定でValueRangePieChartを作成します。dividesで分割する数を指定することで範囲が決まります(この例ですと100を5分割するので1つの範囲が20ということになります)
これをLiveモードで開くと以下のようになります。
まとめ
INFOMOTIONはグラフの右上にある日付指定コントロールの抽出条件によって絞りこまれた時系列データを扱いますので、PieChartやValueRangePieChartは抽出期間のデータの割合を見るという用途に便利だと思います。
