enebular Advent Calendar 2016 8日目のenebular の INFOMOTION を他のサイトに貼り付けるの通り作成したINFOMOTIONは外部に埋め込むことが可能です。これを応用すれば作成した複数のINFOMOTONを配置してダッシュボードを作成することも可能です。
初歩デモ準備
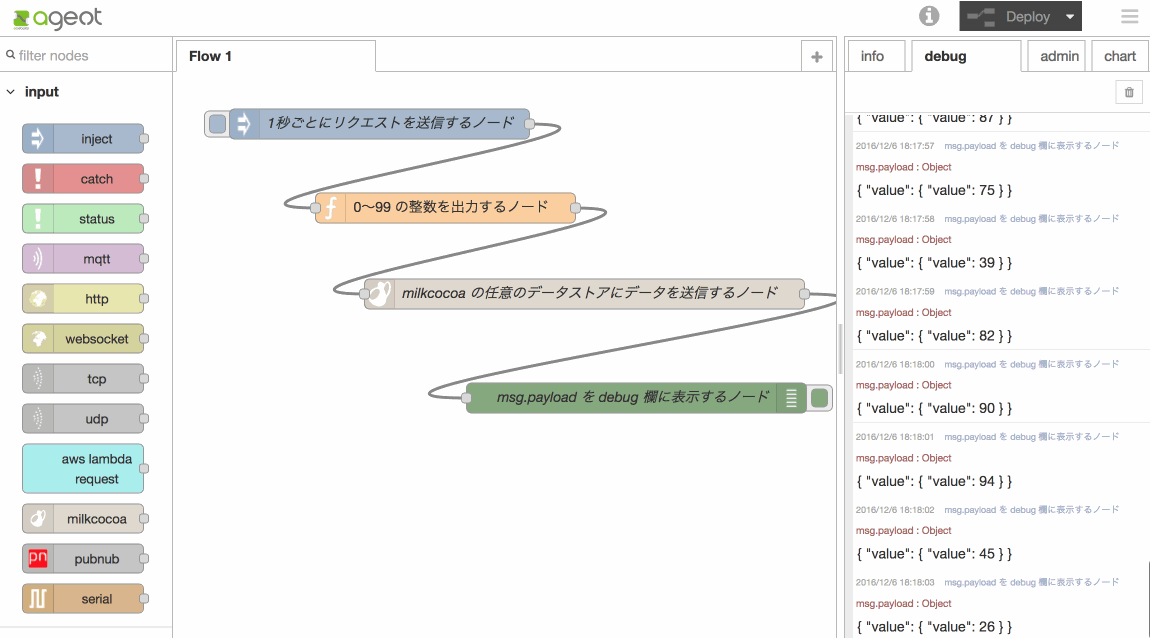
enebular Advent Calendar 2016初日の@satton_maroyakaのエントリ、enebularをつかいはじめるにあるスライドを見て準備すると以下のようになります。
今回は標準INFOMOTION Typeの多数のグラフで利用できるようにランダム発生データを少し変更します。Functionノードを開いて以下のように変更します。
msg.payload = {
    id : "value" + Math.floor(Math.random() * 5),
    value : Math.floor(Math.random() * 100),
    value1 : Math.floor(Math.random() * 100)
};
return msg;
複数グラフを作る
BarChart、LineChart、PieChart、ValueRangePieChart、CombinationChart、MetricsGraphicsの6種類のグラフを作成します。
BarChart
設定は以下です。
| 項目 | 設定する値 |
|---|---|
| TYPE | barchart |
| DATASOURCE | Milkcocoa(設定したデータソース名) |
| label | id |
| value | value |
以下のようなグラフになればOKです。
LineChart
設定は以下です。
| 項目 | 設定する値 |
|---|---|
| TYPE | linechart |
| DATASOURCE | Milkcocoa(設定したデータソース名) |
| label | id |
| value | value |
以下のようなグラフになればOKです。
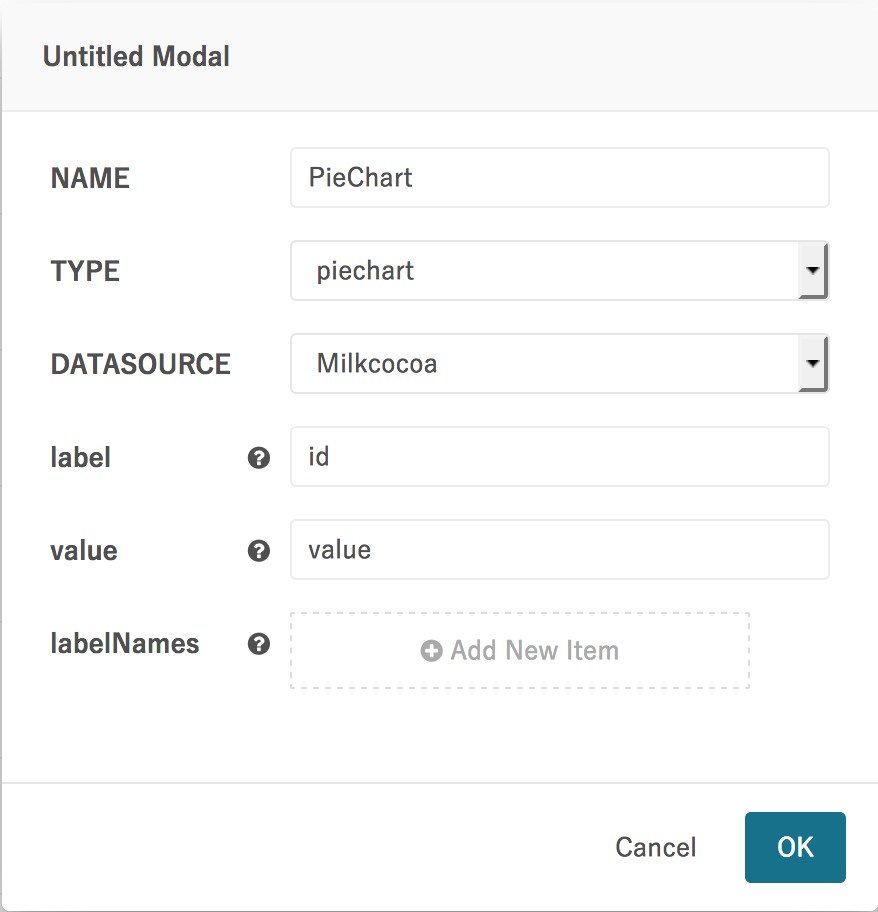
PieChart
設定は以下です。
| 項目 | 設定する値 |
|---|---|
| TYPE | piechart |
| DATASOURCE | Milkcocoa(設定したデータソース名) |
| label | id |
| value | value |
以下のようなグラフになればOKです。
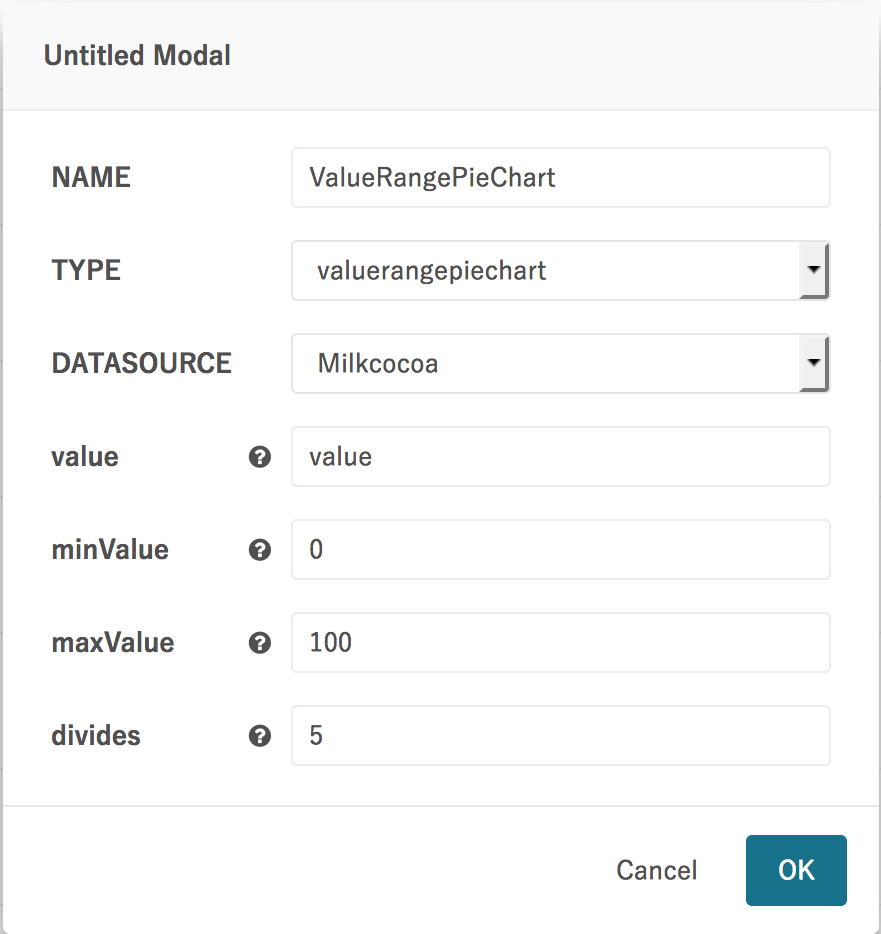
ValueRangePieChart
設定は以下です。
| 項目 | 設定する値 |
|---|---|
| TYPE | valuerangepiechart |
| DATASOURCE | Milkcocoa(設定したデータソース名) |
| value | value |
| minValue | 0 |
| maxValue | 100 |
| divides | 5 |
以下のようなグラフになればOKです。
CombinationChart
設定は以下です。
| 項目 | 設定する値 |
|---|---|
| TYPE | valuerangepiechart |
| DATASOURCE | Milkcocoa(設定したデータソース名) |
| label | id |
| valueBar | value |
| valueLine | value1 |
以下のようなグラフになればOKです。
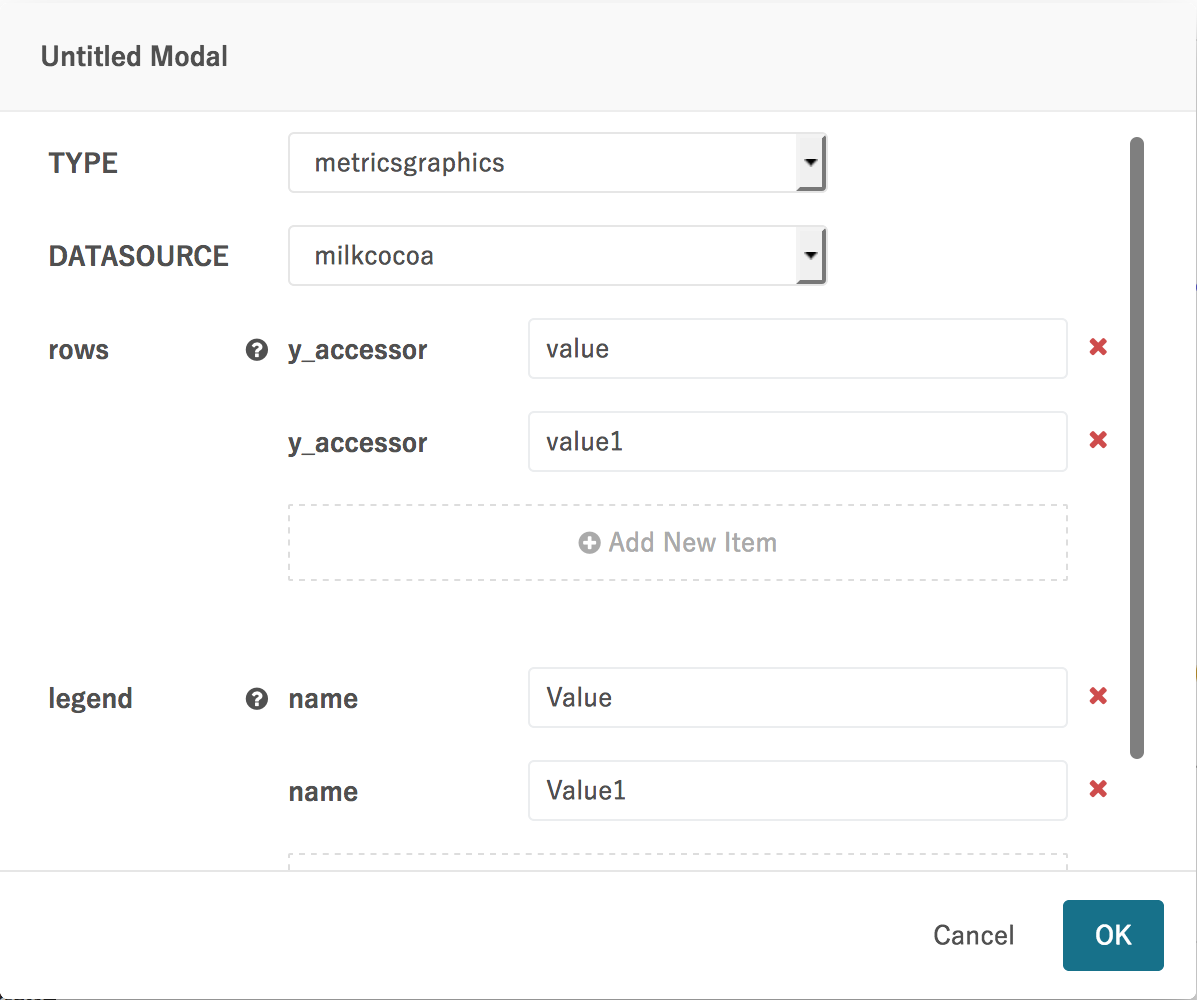
MetricsGraphics
設定は以下です。
| 項目 | 設定する値 |
|---|---|
| TYPE | metricsgraphics |
| DATASOURCE | Milkcocoa(設定したデータソース名) |
| rows y_accessor | value |
| rows y_accessor | value1 |
| legend name | Value |
| legend name | Value1 |
| limit | 20 |
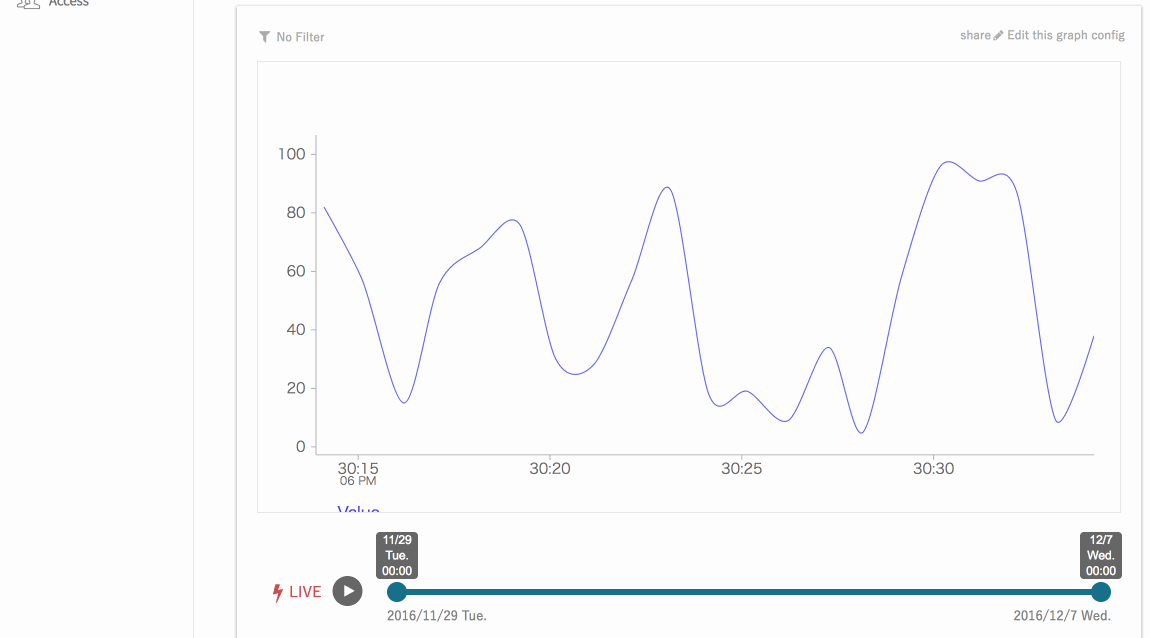
以下のようなグラフになればOKです。
まとめて外部に埋め込み
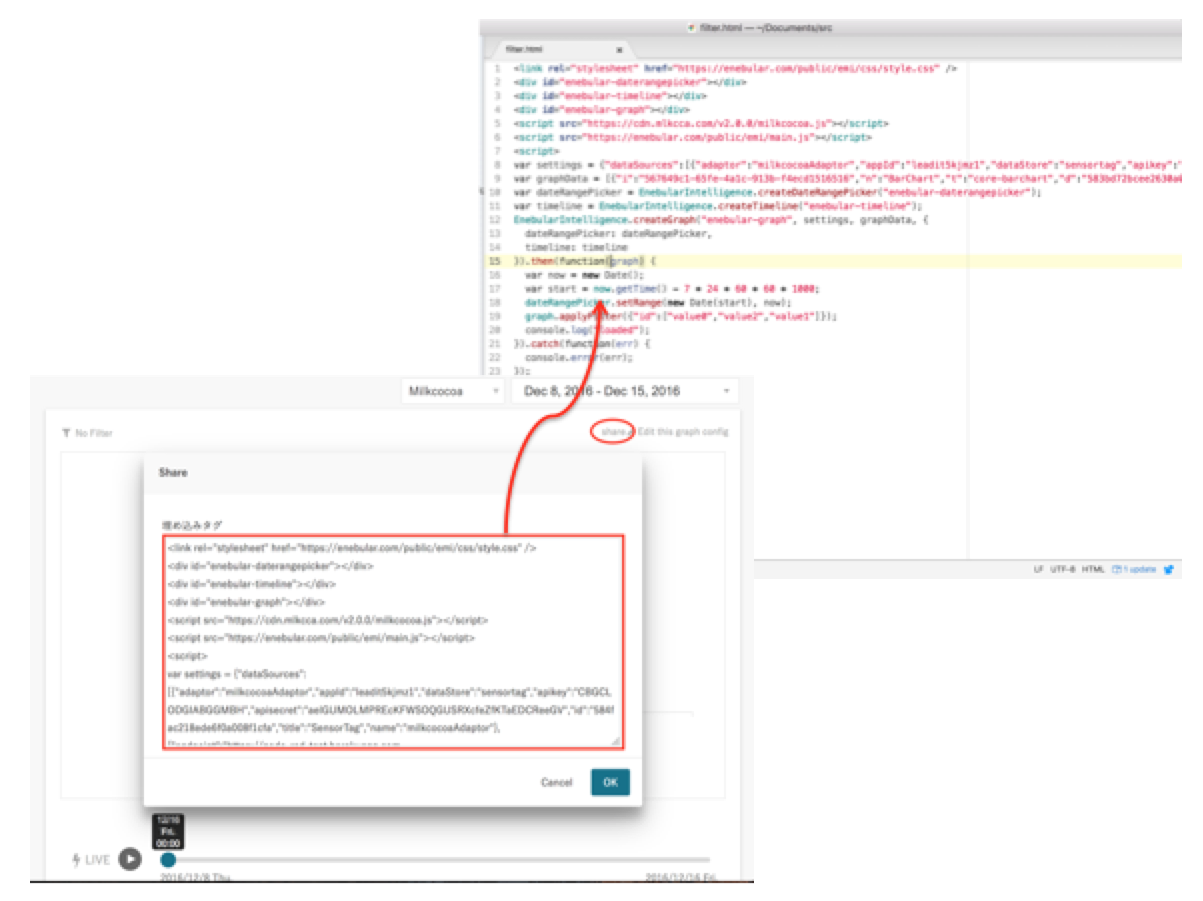
BarChartのshareリンクをクリックして表示されるHTMLタグをローカルファイルとして保存します。
これでローカルのHTMLファイルをブラウザで開くと棒グラフだけ表示されます。
複数グラフを1画面で表示するためには以下のようにPromiseで組み合わせます。
<link rel="stylesheet" href="https://enebular.com/public/emi/css/style.css" />

<!-- タイル調に並べるスタイル指定 -->
<style>
.enebular-graph {
	float: left;
	height: 400px;
	width: 500px;
}
</style>

<div id="enebular-daterangepicker"></div>
<div id="enebular-timeline"></div>

<!-- グラフの数だけ以下を増やす -->
<div id="enebular-graph1" class="enebular-graph"></div>
<div id="enebular-graph2" class="enebular-graph"></div>
<div id="enebular-graph3" class="enebular-graph"></div>
<div id="enebular-graph4" class="enebular-graph"></div>
<div id="enebular-graph5" class="enebular-graph"></div>
<div id="enebular-graph6" class="enebular-graph"></div>

<script src="https://cdn.mlkcca.com/v2.0.0/milkcocoa.js"></script>
<script src="https://enebular.com/public/emi/main.js"></script>
<script>
var settings = {...}

// グラフの数だけ以下を増やす
var graphData1 = [...]; // BarChartのgraphData
var graphData2 = [...]; // LineChartのgraphData
var graphData3 = [...]; // PieChartのgraphData
var graphData4 = [...]; // ValueRangePieChartのgraphData
var graphData5 = [...]; // CombinationChartのgraphData
var graphData6 = [...]; // MetricsGraphicsのgraphData

var dateRangePicker = EnebularIntelligence.createDateRangePicker("enebular-daterangepicker");
var timeline = EnebularIntelligence.createTimeline("enebular-timeline");

// グラフの数だけ以下を増やす
EnebularIntelligence.createGraph("enebular-graph1", settings, graphData1, {
	dateRangePicker: dateRangePicker,
	timeline: timeline
}).then(function() {
	return EnebularIntelligence.createGraph("enebular-graph2", settings, graphData2, {
		dateRangePicker: dateRangePicker,
		timeline: timeline
	});
}).then(function() {
	return EnebularIntelligence.createGraph("enebular-graph3", settings, graphData3, {
		dateRangePicker: dateRangePicker,
		timeline: timeline
	});
}).then(function() {
	return EnebularIntelligence.createGraph("enebular-graph4", settings, graphData4, {
		dateRangePicker: dateRangePicker,
		timeline: timeline
	});
}).then(function() {
	return EnebularIntelligence.createGraph("enebular-graph5", settings, graphData5, {
		dateRangePicker: dateRangePicker,
		timeline: timeline
	});
}).then(function() {
	return EnebularIntelligence.createGraph("enebular-graph6", settings, graphData6, {
		dateRangePicker: dateRangePicker,
		timeline: timeline
	});
}).then(function() {
	var now = new Date();
	var start = now.getTime() - 7 * 24 * 60 * 60 * 1000;
	dateRangePicker.setRange(new Date(start), now);
	console.log("loaded");
}).catch(function(err) {
	console.error(err);
});
</script>
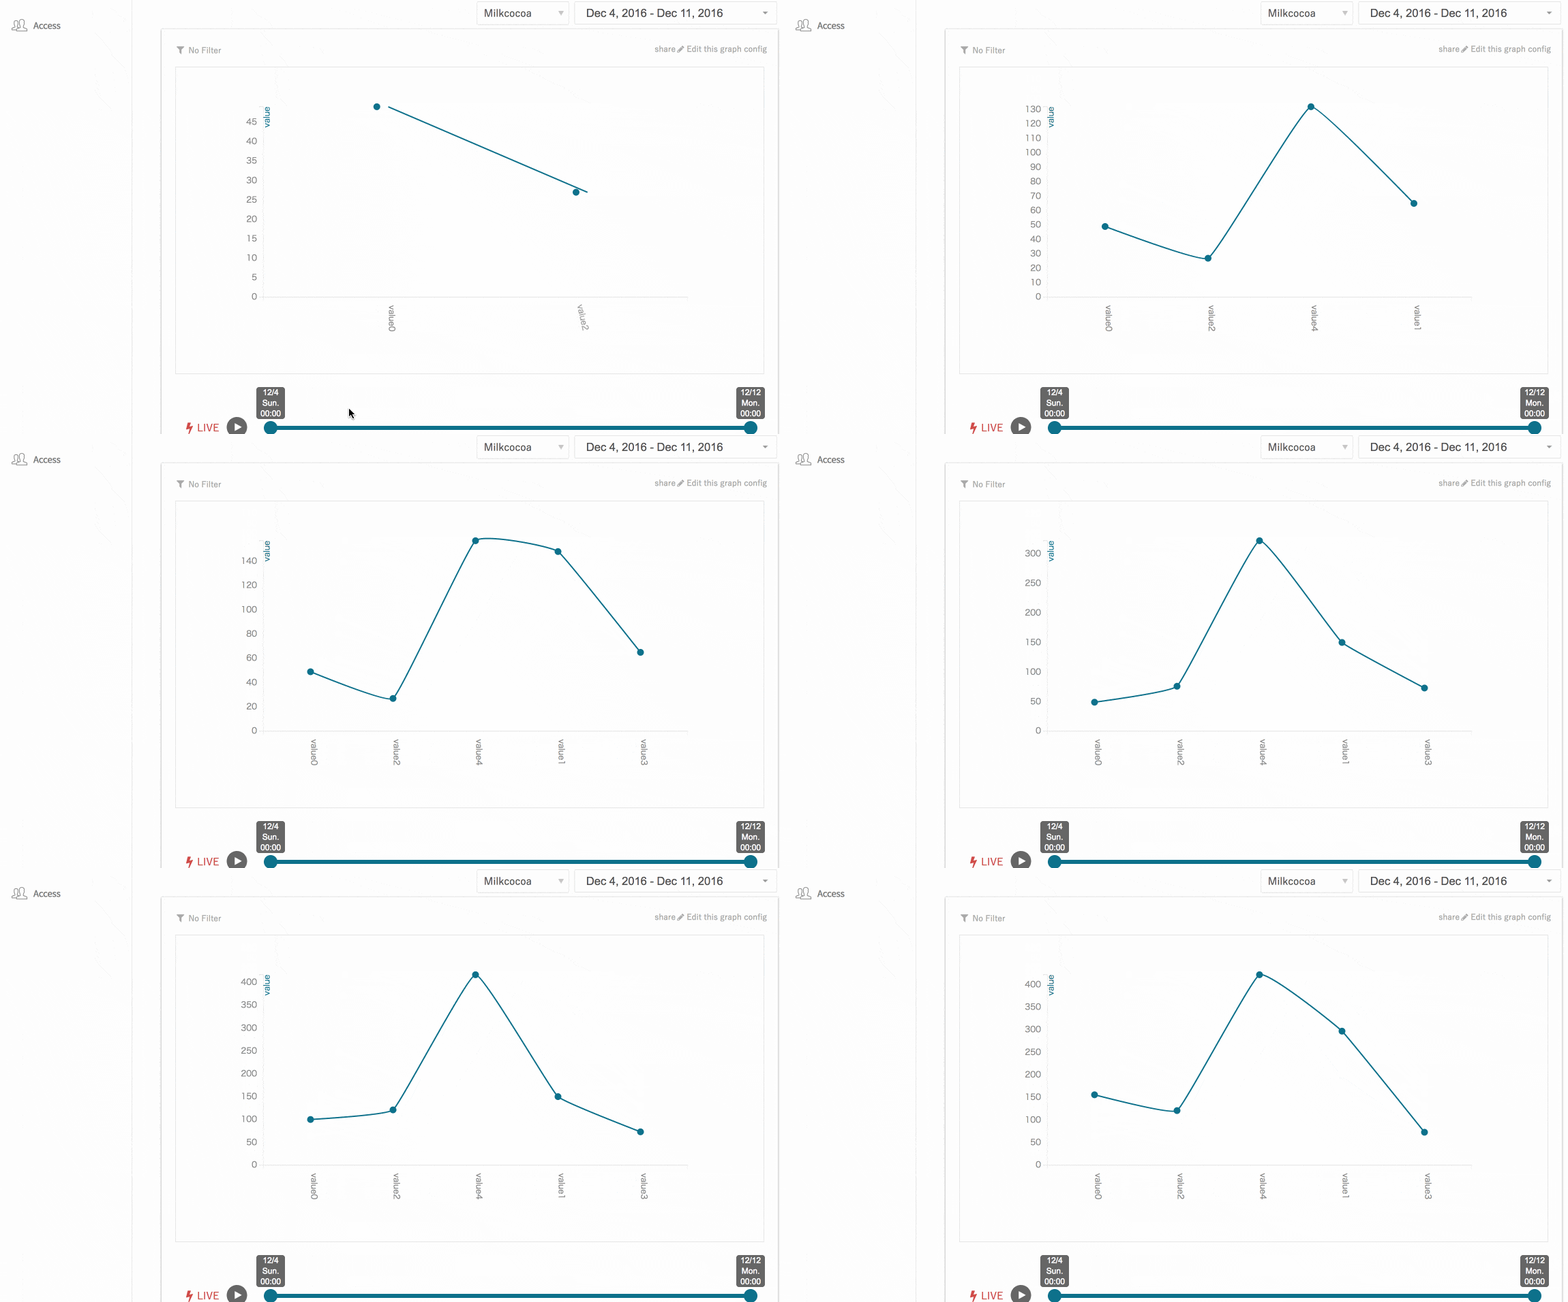
これで以下のように複数グラフを並べて表示できます。
まとめ
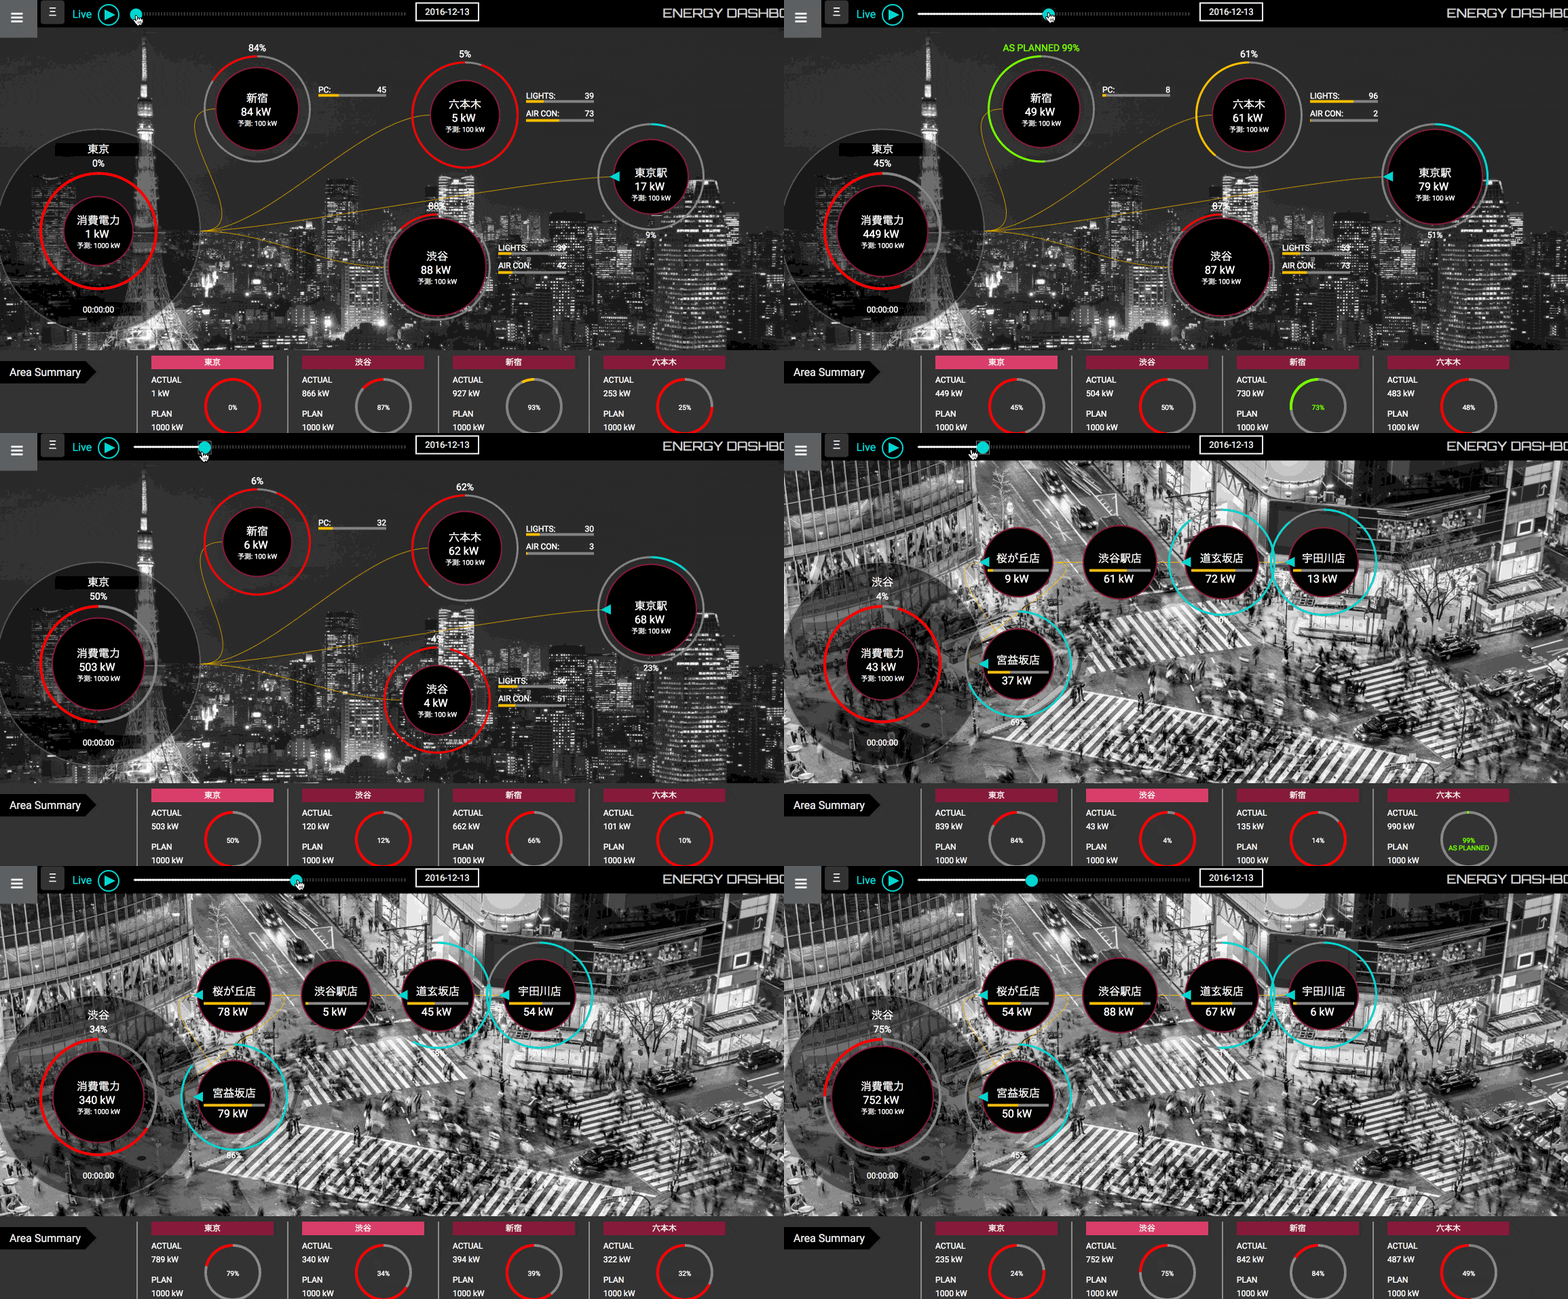
あとはスタイルなど体裁を整えることで以下のようなINFOMOTIONを作ることも可能です。
