困ったらawkを呼び出していた自分へのメモ
ヘッダーを飛ばす
例: 先頭10行(列名など)を飛ばす
gnuplot> plot "hoge.txt" every ::10
everyで指定。
1行目のみヘッダーの場合は、
区切り文字
例: csvファイル
gnuplot> set datafile separator ","
条件に合う範囲のみをプロット
例: 二列目が2以上ならそのままプロット、2以下はゼロに
gnuplot> plot "hoge.txt" using 1:($2>2 ? $2 : 0)
三項演算子?をつかっている。
データ加工
例: 1列目をx,3列目をyに描画する時、3列目を100倍
gnuplot> plot "hoge.txt" using 1:($3*100)
usingで指定。加工する軸では( )と$を忘れずに!!
複数データの表示
replotはやめて,を使う
gnuplot> plot "hoge.txt", "fuga.txt"
gnuplot> plot "hoge.txt" using 1:2, "hoge.txt" using 1:3
plot内でデータを,でつなぐ
replotを多用すると.epsや.pdf出力で嵌る(グラフがたくさん出てくるよ)ので、オススメしない。
(replotは、あくまでも再描画の意味で、replot "data"では、再描画時にデータを上書きするという意味になる。)
plot forで賢く
gnuplot> plot "hoge.txt" using 1:2, "hoge.txt" using 1:3, "hoge.txt" using 1:4
gnuplot> plot for [i=2:4] "hoge.txt" using1:i
gnuplot> plot for [i=2:*] "hoge.txt" using1:i
hoge.txtに4列のデータがあり、1列目をxに、2~4列目をyにする場合、上記3行は同じ意味となる
plot forを使うと、,で書き下さなくてもよくなる
plot for [i=2:*]とすると、 最終列まで描画してくれる
ただし、plot forはgnuplot ver 4.4以降でないといけない(らしい)
titleをつけると、なおよし
gnuplot> plot for [i=2:*] "hoge.txt" using 1:i title sprintf("%d",i)
titleでプロットデータの凡例
sprintf()の" "は、%dが書式(整数)で、他に任意の文字を入れれる
つまり、sprintf("number: %d",i)とかすると、凡例がnumber : 1などとなる
1列目にタイトルが並んでいるならばcolumnheader(i)
gnuplot> plot for [i=2:*] "hoge.txt" using 1:i title columnheader(i)
columheader(i)はgnuplotのデフォルト関数で、1行目のi列目の文字列を返してくれる
例えば下記のように、化学組成が分析毎に並んでいる場合、
measure C O Fe-L Mg Al Si S Cl Ca Cr Fe-K Co Ni Cu
1 369162 136654 16894 24230 6015 43864 29975 13965 6146 181 37332 6567 2621 13747
2 370436 133514 17154 24277 6102 43712 29662 13737 6178 159 37230 6544 2704 13704
3 369622 130737 17036 24093 6094 43985 29920 13796 6156 157 38031 6563 2663 13513
4 371086 126829 16972 24287 5991 43373 29739 13910 6089 152 37345 6331 2719 13373
5 368830 125949 17080 24233 6106 43506 30016 13826 5994 165 37613 6404 2706 13212
...
plot forとcolumnheader()を使い、
gnuplot> plot for [i=2:*] "data.txt" using 1:i title columnheader(i) with linepoint
とすると、下記のようなグラフが1行で描ける
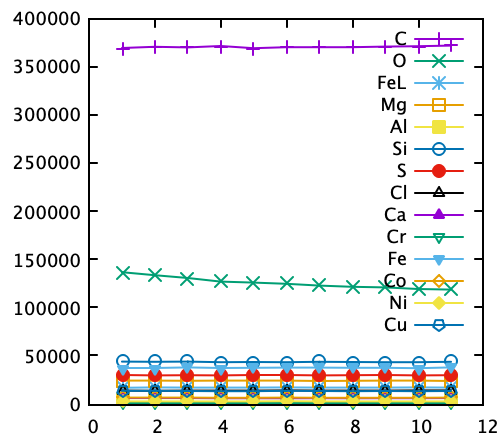
lを押して、対数表示にしてもいいかも。
ちなみにwith linepointで、点+線描画です。
(Oの減少が他よりも速いですねぇ。。。)
なお、
gnuplot> set key autotitle columnheader
gnuplot> plot for [i=2:*] "out.txt" using 1:i w lp
も同じ出力結果を得るが、set autokey columnheaderでtitle columnheader(i)を自動設定したという解釈。他のデータフォーマットと合わせてplotすると混乱の元。混ぜな危険。
このくらいできると表計算ソフトに入れて表示するよりgnuplotを使う方が便利と実感できるはず。
逆に、何か計算結果・分析結果をテキストファイルにまとめる時は、1行目にタイトルをつけることを習慣づけると吉。
おまけ: ワンライナーの虜さんへ
これで幸せを感じられるかも?
gnuplot> p for [i=2:*] "out.txt" u 1:i w lp t columnheader
pはplot、uはusing、w lpはwith lineplot、tはtitleです。
また、columnheader(i)はcolumnheaderです。
暗号だね。
データ補間
大量の描画点に対して傾向を見たい時に。
gnuplot> plot "hoge.txt" smooth sbezier
smooth optionで指定。
with lineplotなどは省くこと。
optionには補間方法が入る。
統計ノイズの場合は、sbezier(ベジエ曲線)やacsplines(スプライン曲線)とかでしょうか。
詳しくはマニュアルへですが、重みの設定もできるようです。
頻度分布(ヒストグラム)
gnuplot 5.3のマニュアルを読むと、下記のようにすればいいらしい。
gnuplot
EXPERIMENTAL (implementation details may change in a later version) Syntax:
plot ’DATA’ using {:} bins{=}
{binrange [:]} {binwidth=}
floor関数やint関数で頻度を調べてからplotするやり方もあるらしい(古い方法?)
例: 7列目にあるデータを、bin数 10で頻度分布を描画
plot "data.txt" using 7 bins=10 with boxes
例: 6列目にあるデータを、bin数 自動、bin幅=0.5で頻度分布を描画
plot "data.txt" using 6 bins binwidth=0.5 with boxes
例: 5列目にあるデータを、bin数 自動、bin幅=0.5で、20~80の間で頻度分布を描画
plot "data.txt" using 5 bins binrange [20:80] binwidth=10 with boxes
boxの装飾
set style fill solid border lc rgb "black"
plot "data.txt" u 5 with boxes lw 1 lc rgb "light-cyan"
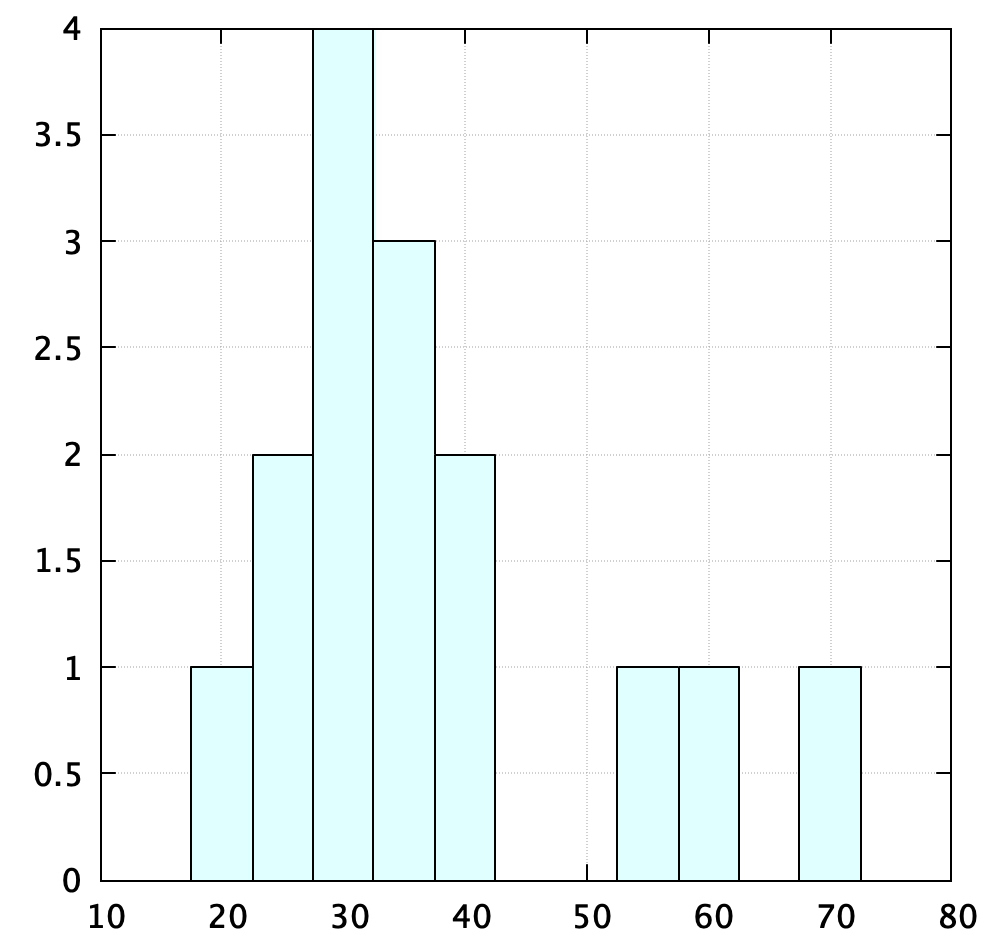
set styleで、box内を塗りつぶし、box枠は黒色と設定
plot内のlwとlcで、外枠太さと塗りつぶしの色を設定
例: 7~10列目にあるデータを、bin幅0.05で頻度分布を描画、1列目をタイトルに。
先の例のように、plot forとt columnheadを用いることができる。
plot for [i=7:10] "data.txt" using i bins=0.05 with boxes t columnhead
下付き文字"_"の無効
set title "hoge_hoge" noenhanced
noenhancedをつける
外部コマンドの呼び出し
例: awkの使用
1列目をx,3列目をyに描画する時、3列目を100倍する時
plot "< cat hoge.txt | awk '{print $1,$3*100}'"
plot内で<を使用
参考
[gnuplot のページ (Takeno Lab)] (http://takeno.iee.niit.ac.jp/~foo/gp-jman/)