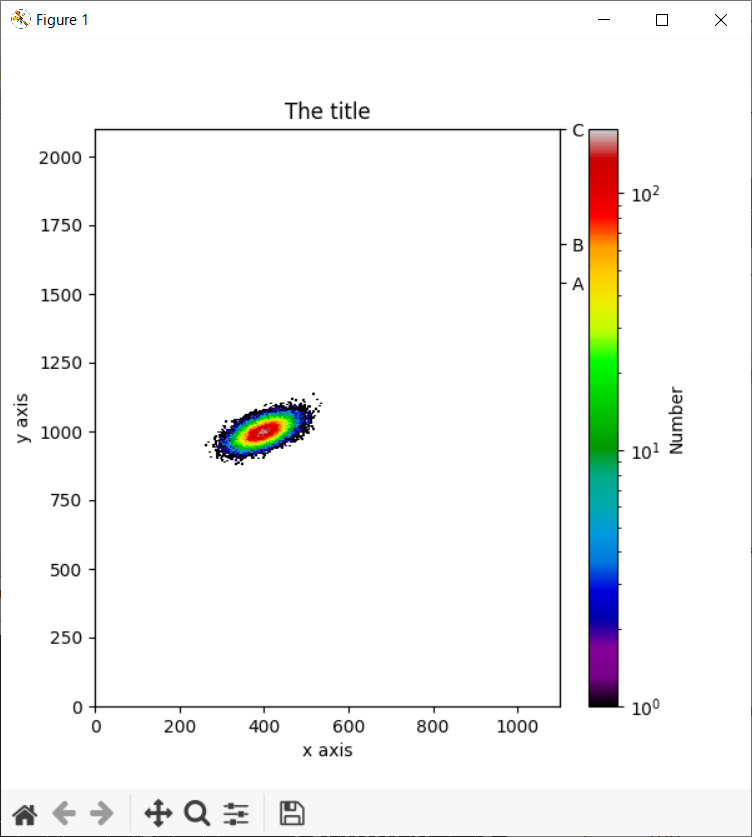
例:y軸に第二軸を追加
上図のy軸の第二軸に、A,B,Cが追加されている。
以下では、(x,y)にランダムな配列を入れて、2dhistogramを描画する。
import numpy as np
import matplotlib
import matplotlib.pyplot as plt
from matplotlib.colors import LogNorm

N_numbers = 100000
N_bins = 100

np.random.seed(0)
x, y = np.random.multivariate_normal(
        mean=[400.0, 1000.0],
        cov=[[1000,500],
             [400,700]],
        size=N_numbers
        ).T


fig, ax = plt.subplots(figsize =(6, 6))
H=ax.hist2d(x, y, bins=N_bins, cmap='nipy_spectral',norm=LogNorm())
plt.xlim([0,1100])
plt.ylim([0,2100])

cb = fig.colorbar(H[3],ax=ax)
cb.set_label('Number')

plt.title('The title')
plt.xlabel('x axis')
plt.ylabel('y axis')

ax2 = ax.twinx()
ax2.set_ylim(0,2100)
plt.yticks([1100,1200,1500], ["A","B","C"])

plt.show()
第二軸の追加は、後ろから4行目を追加するだけ。
ax.twinx()として、ax2のx軸をaxと共通化させる。
