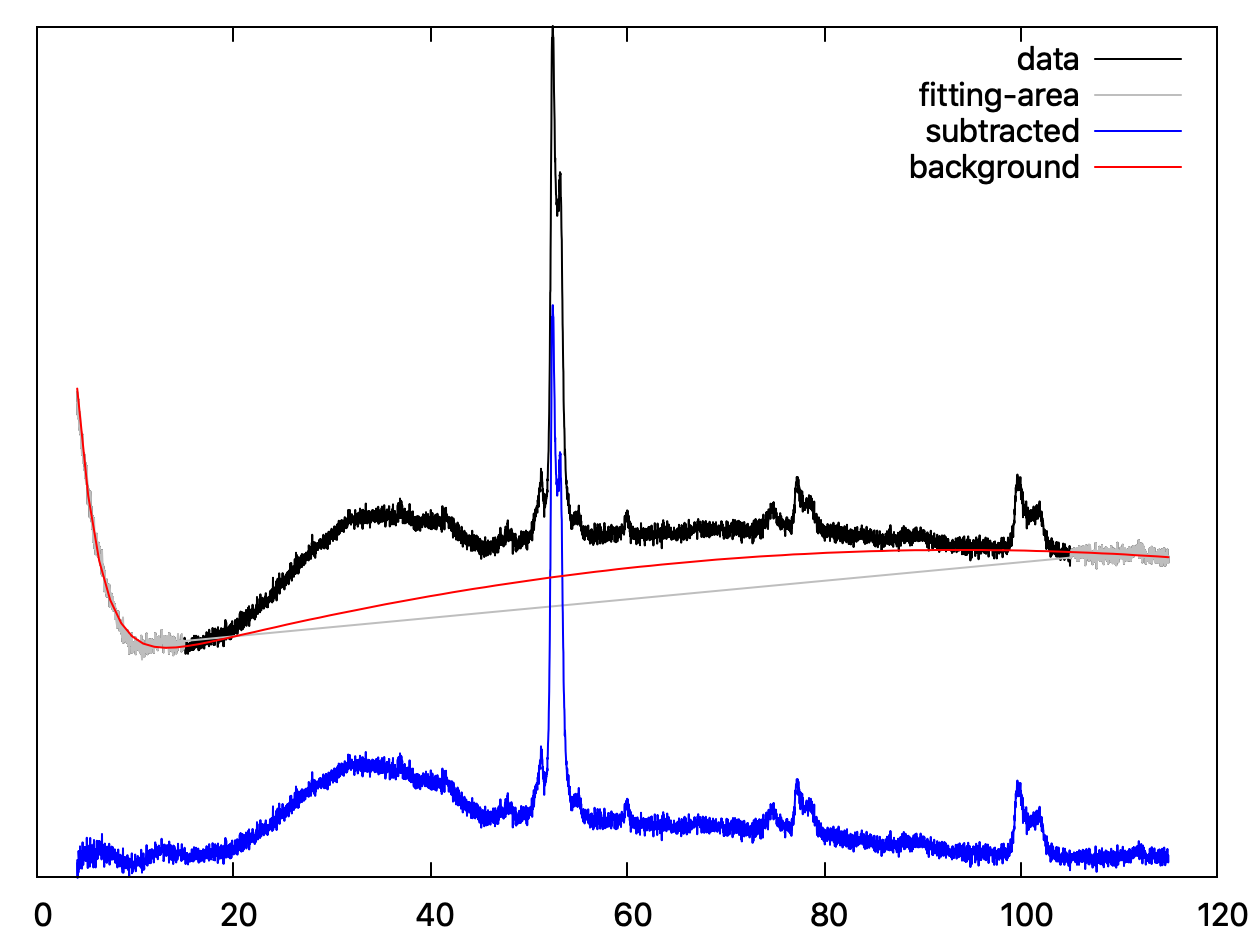
下の図にあるように、実験データ(data)から特定の領域(fitting-area)を使って、バックグラウンドの関数をフィット(background)し、その関数を使ってバックグラウンド減算した実験データ(subtracted)を表示したい。
gnuplotだけを使って、さくっとできたので、投稿する。

データファイル
data.txtに、x, yの順で座標が並んでいるとする。
4.08	13189
4.10	12800
4.12	12550
4.14	12909
4.16	12853
...(略)...
114.90	8348
114.92	8368
114.94	8498
114.96	8334
114.98	8526
目標
今回は、指数関数と二次関数の重ね合わせである
$$ bg(x) = A exp(-B(x-C))+ D x^2 + E x + F $$
をフィット関数に用いて、データ点のうち、$$x<15, 105<x$$を使ってフィッティングしたいとする。
gnuplot code
bg(x) = A * exp(-B*(x-C)) + D*x**2 + E*x + F
fit bg(x) "<awk '{if (($1<15)||($1>105)) print $0}' data.txt " via A,B,C,D,E,F
1行目は、bg(x)の関数の定義。
2行目は、fitでフィッティングしている。
"<awk ...(略)... data.txt"で、外部コマンドであるawkにdata.txtを読み込ませていて、
その条件がif文の中に入っている。
なお、gnuplotで階乗は**
もし、$$0<x<15$$を使う、といったように一つの区間で表せれるなら、2行目はawkを使うまでもなく、
fit [0:15] bg(x) "data.txt " via A,B,C,D,E,F
のように、fitのオプションで指定して、書くこともできる。
グラフ表示
実はこのやり方が調べてもわからなかったので、ハマってしまった。
plot "data.txt" using 1:($2-bg($1)) w l
usingの中にbg(x)をいれる。
xに代入するのは、usingオプションでx軸を意味する$1