環境
- Google Colaboratory
- Python3.6.8
- GraphvizとそのPythonラッパーであるgraphvizはColabにインストールされていた
やりたいこと
- 二分木をビジュアライズする
- 適当なルールでノードを色分けできるようにする
- インプットはノードのリストで行う
書いたコード
from graphviz import Digraph
from IPython.display import Image, display

class GraphNodes():

    def __init__(self,node_list, graph_attr_dict=None):
        if graph_attr_dict:
            self._graph = Digraph(**graph_attr_dict)
        else:
            self._graph = Digraph()
        if not self._graph.format in ['jpeg','png']:
            self._graph.format = 'png'

        self._original_graph = self._graph.copy()

        self.nodes = node_list
        for i in range(0,len(self.nodes)):
            self._graph.node(name=str(i), label=str(self.nodes[i]))

        self._node_groups = {}

    @property
    def node_groups(self):
        return self._node_groups

    def add_node_group(self, group_name, node_attr_dict):
        self._node_groups[group_name]={}
        node_attr_dict.pop('name', None)
        self._node_groups[group_name]['node_attr_dict'] = node_attr_dict
        self._node_groups[group_name]['node_indices'] = []

    def update_node_attr(self):
        for ng in self._node_groups.values():
            for i in ng['node_indices']:
                if not i in range(0, len(self.nodes)):
                    continue
                self._graph.node(str(i),**ng['node_attr_dict'])

    def init_node_attr(self):
        self._graph =  self._original_graph
        for i in range(0,len(self.nodes)):
            self._graph.node(name=str(i), label=str(self.nodes[i]))
        for ng in self._node_groups:
            self._node_groups[ng]['node_indices']=[]

    def viz(self):
        self.update_node_attr()
        display(Image(self._graph.render()))

    def viz_as_tree(self):
        self.update_node_attr()
        viz_graph = self._graph.copy()
        n = len(self.nodes)

        if n>1:
            for i in range(0, (n%2 + n//2)):
                if n > 2*i+1:
                    viz_graph.edge(str(i), str(2*i+1))
                if n > 2*i+2:
                    viz_graph.edge(str(i), str(2*i+2))

            if n%2==0:
                viz_graph.node(str(n), label="",color="transparent" )
                viz_graph.edge(str((n-1)//2), str(n), color="transparent")

        display(Image(viz_graph.render()))
使い方
※attributeはGraphvizのドキュメント参照
n_list = [1,5,3,1,4,6,7]
g_attr = {"format":"png","graph_attr":{'ordering':'out', 'bgcolor':'white',
'dpi':'55'},
"node_attr":{'shape': 'circle'}}
gn = GraphNodes(n_list, g_attr)
gn.add_node_group('hoge', {'shape':'box'})
gn.node_groups['hoge']['node_indices'].extend([0,1,3])
gn.add_node_group('fuga', {'color':'green'})
gn.node_groups['fuga']['node_indices'].extend([2,4])
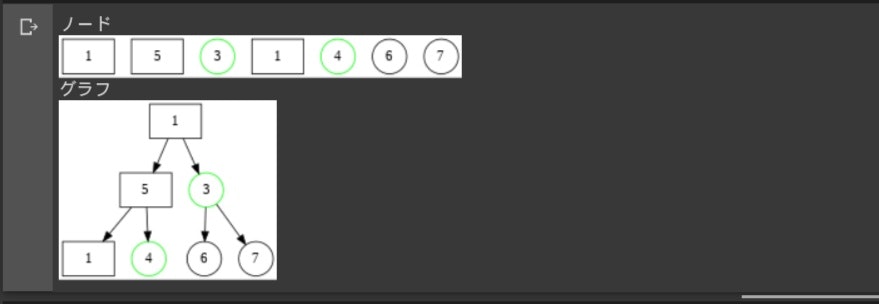
print('ノード')
gn.viz()
print('グラフ')
gn.viz_as_tree()
実行結果