概要
極座標のプロットを描くには
ax = plt.subplot(111, polar=True)
のように polar=true を指定すればよいのですが、
デフォルトでは東が0度、反時計回りのプロットが描かれます。
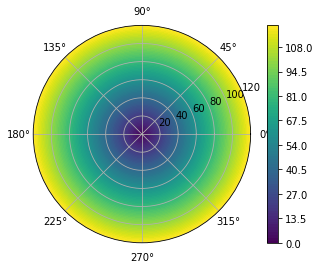
方角ごとのデータを扱いたい場合などは北を0度、時計回りにしたいこともあります。
以下の通り設定すればOKです。
ax.set_theta_direction(-1)
ax.set_theta_zero_location("N")
コード
polar.py
import matplotlib.pyplot as plt
import numpy as np

theta = np.linspace(0, 2*np.pi, 100)
r = np.linspace(0, 120, 100)

tt, rr = np.meshgrid(theta,r)
z = rr

ax = plt.subplot(111, polar=True)

ax.set_theta_direction(-1)
ax.set_theta_zero_location("N")

ctf = plt.contourf(tt, rr, z, 100)

plt.colorbar()
plt.show()
出力
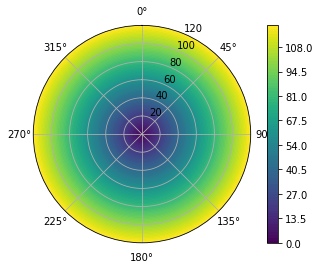
素晴らしい。