0
0

Delete article

Deleted articles cannot be recovered.

Draft of this article would be also deleted.

Are you sure you want to delete this article?

More than 5 years have passed since last update.

【画像処理100本ノックに挑戦】Q.20. ヒストグラム表示

Posted at

使用したライブラリ

【画像処理100本ノック】独自の画像入出力クラスを作る

Q.20. ヒストグラム表示

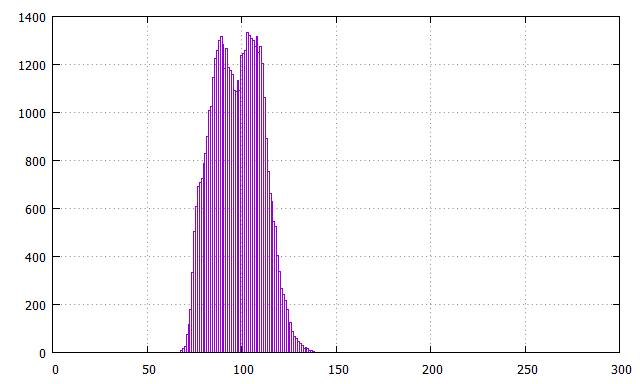
matplotlibを用いてimori_dark.jpgのヒストグラムを表示せよ。

簡単です。注意が必要なのは、ここでいうヒストグラムはRチャンネルのヒストグラム+Gチャンネルのヒストグラム+Bチャンネルのヒストグラムのことを想定しているらしいということです。
最初はグレースケールに対するヒストグラムかと思いました。正解出力が掲載されているので少し考えればわかりますが、少し不親切に感じました。特に言及なく、グレースケール画像が対象であることを想定した問題もありますし。

int main()
{
	PPM ppm("imori_dark.pnm");
	int width = ppm.Get_width();
	int height = ppm.Get_height();
	
	int N = 256;
	std::vector<int> hist(N);
	for (int n = 0; n < N; n++)
	{
		hist[n] = 0;
	}

	for(int j=0; j<height; j++)
		for (int i = 0; i < width; i++)
		{
			hist[ppm(i, j, 'r')]++;
			hist[ppm(i, j, 'g')]++;
			hist[ppm(i, j, 'b')]++;
		}

	for (int n = 0; n < N; n++)
	{
		std::cout << n << " " << hist[n] << std::endl;
	}


	return 0;
}

image.png

これで20問完了です!

0
0
0

Register as a new user and use Qiita more conveniently

  1. You get articles that match your needs
  2. You can efficiently read back useful information
  3. You can use dark theme
What you can do with signing up
0
0

Delete article

Deleted articles cannot be recovered.

Draft of this article would be also deleted.

Are you sure you want to delete this article?