統計学や機械学習をを勉強していると「尤度」という概念に出会います。まず読めないというコメントをいくつかいただきましたが、「尤度(ゆうど)」です。「尤もらしい(もっともらしい)」の「尤」ですね。犬![]() じゃありませんw
じゃありませんw
確率関数や確率密度関数を理解していれば数式的にはこの尤度を処理できると思うのですが、少し直感的な理解のためにグラフィカルに解説を試みたいと思います。
コードの全文はGithub( https://github.com/matsuken92/Qiita_Contents/blob/master/General/Likelihood.ipynb )にも置いてあります。
正規分布を例にとって
正規分布の確率密度関数は
f(x)={1 \over \sqrt{2\pi\sigma^{2}}} \exp \left(-{1 \over 2}{(x-\mu)^2 \over \sigma^2} \right)
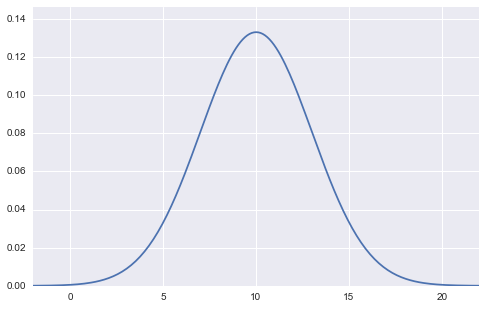
と表せます。グラフにするとこんな感じですね。
(平均10, 標準偏差3の正規分布の図)
%matplotlib inline
import matplotlib.pyplot as plt
import matplotlib.cm as cm
import numpy as np
import seaborn as sns
import numpy.random as rd

m = 10
s = 3

min_x = m-4*s
max_x = m+4*s

x = np.linspace(min_x, max_x, 201)
y = (1/np.sqrt(2*np.pi*s**2))*np.exp(-0.5*(x-m)**2/s**2)

plt.figure(figsize=(8,5))
plt.xlim(min_x, max_x)
plt.ylim(0,max(y)*1.1)
plt.plot(x,y)
plt.show()
この図は、平均$\mu$、標準偏差$\sigma$の2つのパラメーターの値が確定しており(上図の場合は平均$\mu=10$、標準偏差$\sigma=3$)、$x$を変数として横軸に取っているグラフになります。アウトプットとしての縦軸は確率密度$f(x)$となっています。
尤度関数の基本概念は、「サンプリングしてデータが観測された後、そのデータは元々どういうパラメーターを持つ確率分布から生まれたものだったか?」と言う問いに答えるためのものです。なので、逆確率的なベイズの定理っぽさがあると自分は思っています。(実際、尤度はベイズの定理を構成する1要素となっています)
(以下、ここでデータと言っていた用語は標本と記します)
ここで、標本が10個手に入り( ${\bf x} = (x_1, x_2,\cdots, x_{10})$ )、それが正規分布に従うことはわかっているが、平均$\mu$、標準偏差$\sigma$の2つのパラメーターの値がどれくらいなのか不明であると言う状況を考えます。

plt.figure(figsize=(8,2))
rd.seed(7)
data = rd.normal(10, 3, 10, )
plt.scatter(data, np.zeros_like(data), c="r", s=50)
「10個の標本がこの値となった同時分布」をまず考えていきます。
また、この10個の標本はiid(独立同一分布:同じ分布から独立に取られた標本)であると仮定します。独立なのでそれぞれの確率密度の積として表せるので、
P(x_1, x_2,\cdots,x_{10}) = P(x_1)P(x_2)\cdots P(x_{10})
となります。ここで$P(x_i)$は全て正規分布としていたので、
P(x_1, x_2,\cdots,x_{10}) = f(x_1)f(x_2)\cdots f(x_{10})
としてもいいですね。これをさらに展開して書くと
P(x_1, x_2,\cdots,x_{10}) = \prod_{i=1}^{10} {1 \over \sqrt{2\pi\sigma^{2}}} \exp \left(-{1 \over 2}{(x_i-\mu)^2 \over \sigma^2} \right)
です。標本$x_i$は$\exp(\cdot)$の中に入りました。
これで標本10個の同時確率密度関数ができました。しかしちょっと待ってください。いま標本は実現値として持っているのでもはや不確定な確率的な値ではありません。確定値です。むしろ分かっていないのは平均$\mu$、標準偏差$\sigma$の2つのパラメーターでした。なので、$x_i$は定数と考え、$\mu$、$\sigma$が変数であると言う風に発想を転換します。
関数の形は全く同じで、変数を$\mu$、$\sigma$であると宣言し直したものを尤度(Likelihood)と定義し
L(\mu, \sigma) = \prod_{i=1}^{10} {1 \over \sqrt{2\pi\sigma^{2}}} \exp \left(-{1 \over 2}{(x_i-\mu)^2 \over \sigma^2} \right)
とします。右辺の形は全く変わりませんね。でも意味合いが変わっているのです。
これをグラフにして理解していきます。
#グラフを書いて理解する
$\mu$、$\sigma$が不明なので、仮に$\mu=0$、$\sigma=1$だと思ってグラフを描くと、
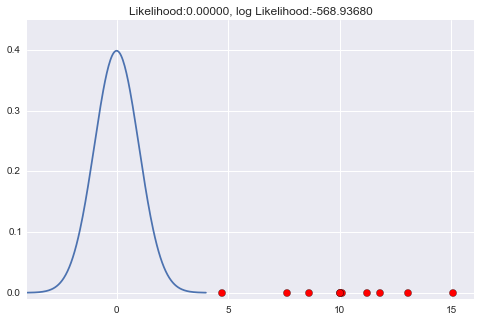
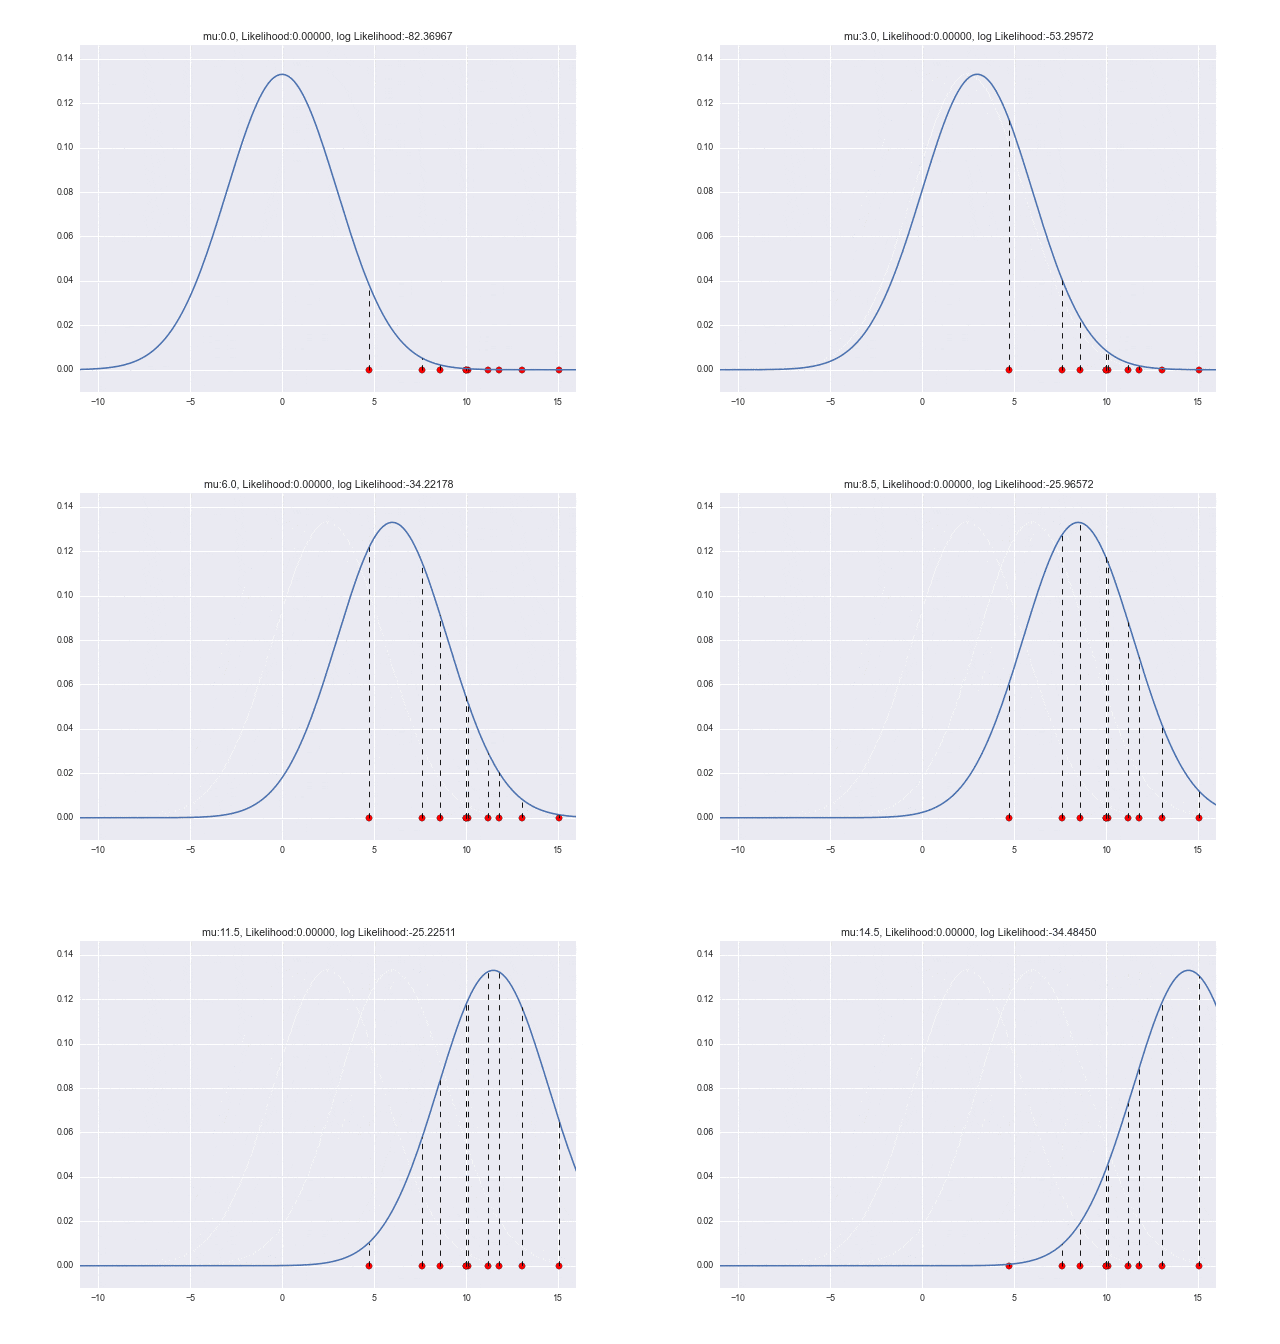
となります。まったくもって外してる感じですね。この時、尤度も値が小さいものとなっています。
(尤度は確率(密度)を標本個数分だけ掛けてできたものなので、0〜1の間の数で何回もかけ算することになり、かなり小さい数、ほぼ0になってしまう。かけ算が足し算にできる計算のしやすさもあり対数尤度とすることが多く、その場合、上記グラフのタイトルにある数値を見てもわかりやすい数値とすることが出来る)
m = 0
s = 1


min_x = m-4*s
max_x = m+4*s

def norm_dens(val):
    return (1/np.sqrt(2*np.pi*s**2))*np.exp(-0.5*(val-m)**2/s**2)

x = np.linspace(min_x, max_x, 201)
y = norm_dens(x)

L = np.prod([norm_dens(x_i) for x_i in data])
l = np.log(L)

plt.figure(figsize=(8,5))
plt.xlim(min_x, 16)
plt.ylim(-0.01,max(y)*1.1)

# 正規分布の密度関数の描画
plt.plot(x,y)

# データ点の描画
plt.scatter(data, np.zeros_like(data), c="r", s=50)
for d in data:
    plt.plot([d, d], [0, norm_dens(d)], "k--", lw=1)

plt.title("Likelihood:{0:.5f}, log Likelihood:{1:.5f}".format(L, l))

plt.show()
確率密度関数がほとんど0の所ばかりに標本があるので、$L(\mu, \sigma)$もかなり小さい尤度となります(対数尤度: 約-568)
試しに今度は、$\mu=5$、$\sigma=4$くらいにしてみましょう。
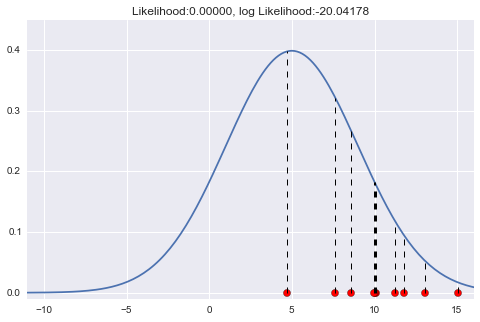
(コードは先ほどのものに$\mu=5$、$\sigma=4$のところだけ変更したもの)
点線で示したところが、各標本に対応する尤度です。さっきよりちょっとあたってきている感じです。今回は対数尤度は約-20とだいぶ大きくなりました。
アニメーションにしてもっと直感的に
$\mu$が変化していくときに尤度がどう変わっていくかをアニメーションで見てみましょう。$\mu=10$で対数尤度が最大となっていることがわかりますね ![]()
from matplotlib import animation as ani

num_frame = 30

min_x = -11
max_x = 21

x = np.linspace(min_x, max_x, 201)


def norm_dens(val, m, s):
    return (1/np.sqrt(2*np.pi*s**2))*np.exp(-0.5*(val-m)**2/s**2)

def animate(nframe):
    global num_frame
    plt.clf()

    m = nframe/float(num_frame) * 15
    s = 3
    y = norm_dens(x, m, s)

    L = np.prod([norm_dens(x_i, m, s) for x_i in data])
    l = np.log(L)

    plt.xlim(min_x, 16)
    plt.ylim(-0.01,max(y)*1.1)

    # 正規分布の密度関数の描画
    plt.plot(x,y)

    # データ点の描画
    plt.scatter(data, np.zeros_like(data), c="r", s=50)
    for d in data:
        plt.plot([d, d], [0, norm_dens(d, m, s)], "k--", lw=1)

    plt.title("mu:{0}, Likelihood:{1:.5f}, log Likelihood:{2:.5f}".format(m, L, l))

    #plt.show()

fig = plt.figure(figsize=(10,7))
anim = ani.FuncAnimation(fig, animate, frames=int(num_frame), blit=True)
anim.save('likelihood.gif', writer='imagemagick', fps=1, dpi=64)
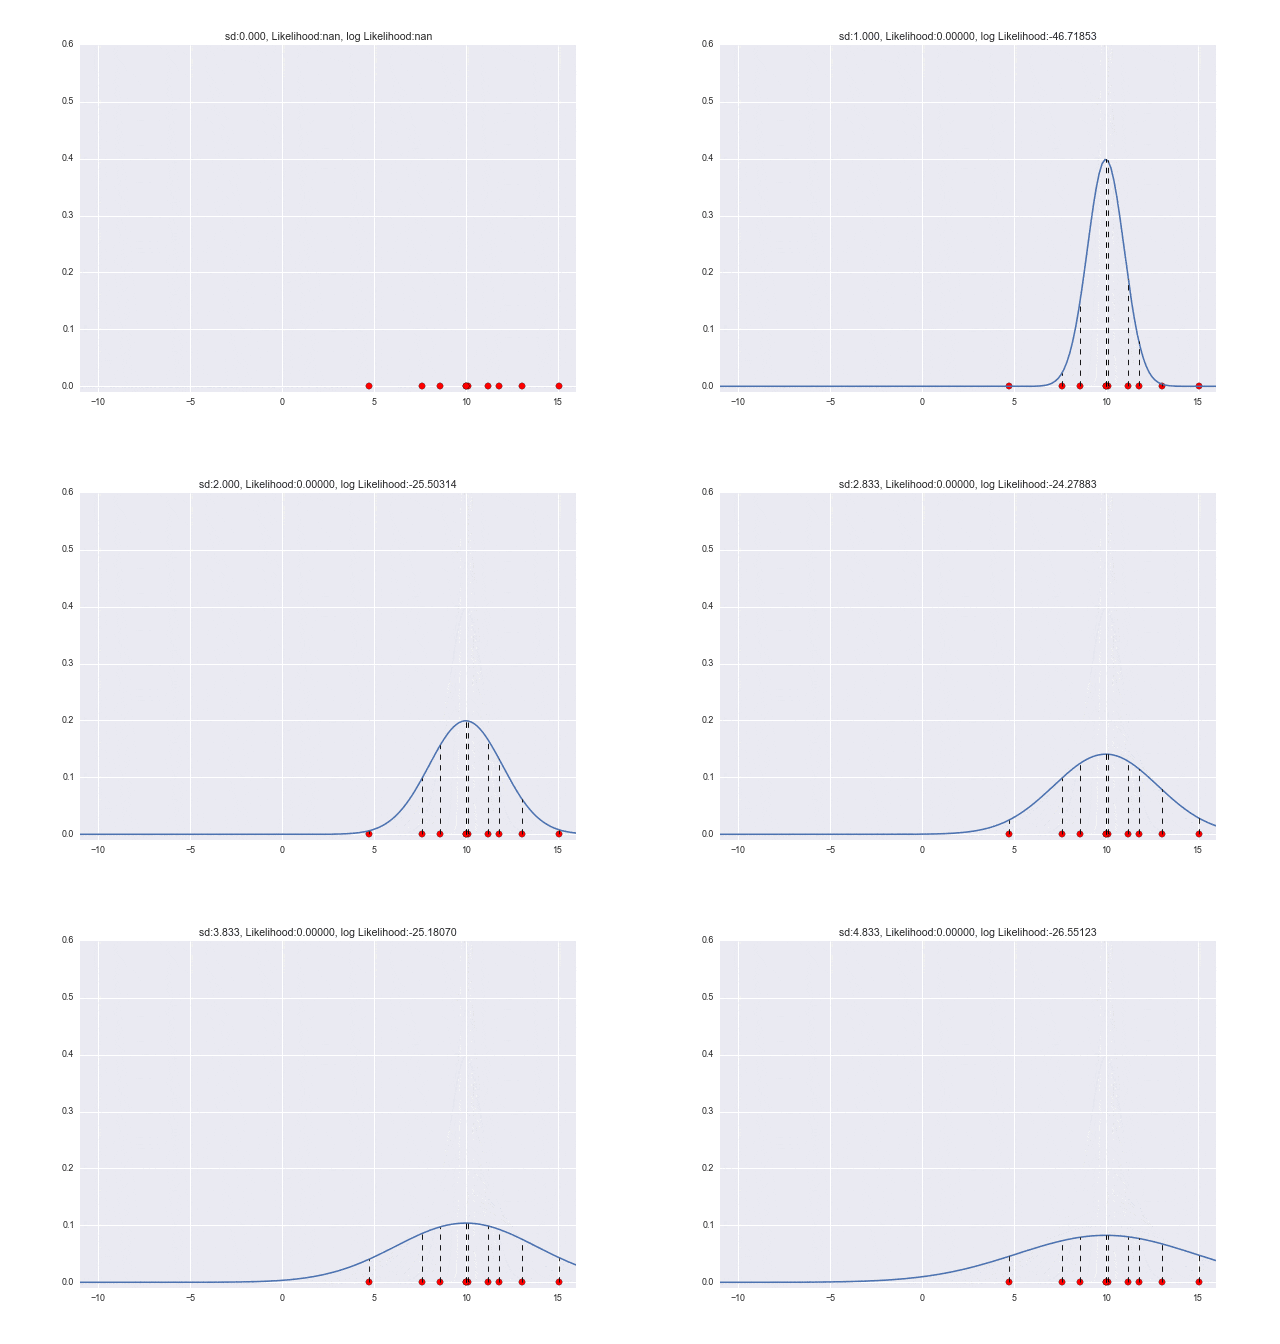
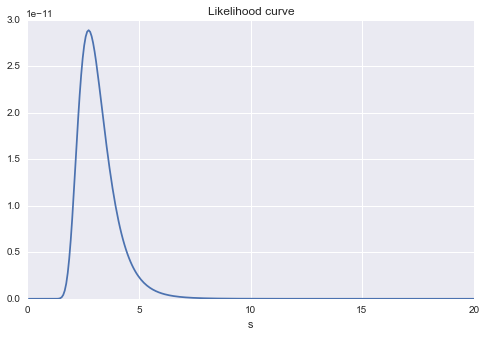
$\sigma$が変わっていくときは、$\sigma=2.7$くらいのときに対数尤度が最大となっていることがわかります。元々データを生成したときは$\sigma=3$だったので、少し誤差がありますが、近しい値が取れていますね ![]()
num_frame = 30

min_x = -11
max_x = 21

x = np.linspace(min_x, max_x, 201)

def norm_dens(val, m, s):
    return (1/np.sqrt(2*np.pi*s**2))*np.exp(-0.5*(val-m)**2/s**2)

def animate(nframe):
    global num_frame
    plt.clf()

    m = 10
    s = nframe/float(num_frame) * 5
    y = norm_dens(x, m, s)

    L = np.prod([norm_dens(x_i, m, s) for x_i in data])
    l = np.log(L)

    plt.xlim(min_x, 16)
    plt.ylim(-0.01,.6)

    # 正規分布の密度関数の描画
    plt.plot(x,y)

    # データ点の描画
    plt.scatter(data, np.zeros_like(data), c="r", s=50)
    for d in data:
        plt.plot([d, d], [0, norm_dens(d, m, s)], "k--", lw=1)

    plt.title("sd:{0:.3f}, Likelihood:{1:.5f}, log Likelihood:{2:.5f}".format(s, L, l))

    #plt.show()

fig = plt.figure(figsize=(10,7))
anim = ani.FuncAnimation(fig, animate, frames=int(num_frame), blit=True)
anim.save('likelihood_s.gif', writer='imagemagick', fps=1, dpi=64)
#最尤推定
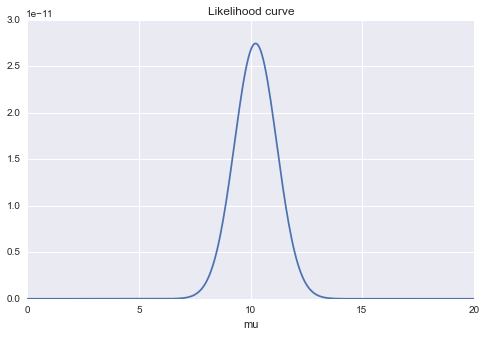
$\mu$を変化させたときの対数尤度の変化のグラフです。尤度を$\mu$で微分して0としたときの$\mu$の値が10あたりになっているだろうことがわかります。これが最尤推定ですね。(とりあえずはsが固定だとして)
# mを変化させる

list_L = []
s = 3

mm = np.linspace(0, 20,300)
for m in mm:
    list_L.append(np.prod([norm_dens(x_i, m, s) for x_i in data]))


plt.figure(figsize=(8,5))
plt.xlim(min(mm), max(mm))
plt.plot(xx, (list_L))
plt.title("Likelihood curve")
plt.xlabel("mu")
同じく$s$の変化に対する尤度の変化グラフです。$s=3$あたりに最大値がありそうなことがやはり見てわかります。
# sを変化させる

list_L = []
m = 10

ss = np.linspace(0, 20,300)
for s in ss:
    list_L.append(np.prod([norm_dens(x_i, m, s) for x_i in data]))

plt.figure(figsize=(8,5))
plt.xlim(min(ss), max(ss))
plt.plot(ss, (list_L))
plt.title("Likelihood curve")
plt.xlabel("s")
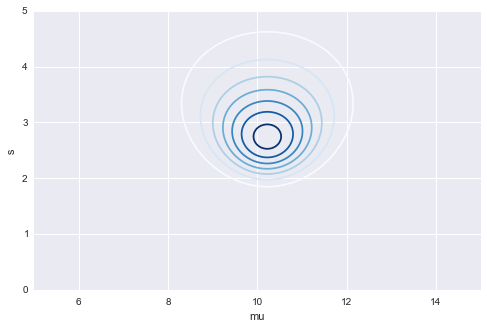
最後に$\mu$と$\sigma$ 同時に見てみると、$\mu$は10ちょっと多め、$\sigma$はちょっと少なめくらいのところに最尤推定して得られる$\mu$と$\sigma$の値がありそうであることがわかります ![]()
# 等高線

plt.figure(figsize=(8,5))
mu = np.linspace(5, 15, 200)
s = np.linspace(0, 5, 200)
MU, S = np.meshgrid(mu, s)

Z = np.array([(np.prod([norm_dens(x_i, a, b) for x_i in data])) for a, b in zip(MU.flatten(), S.flatten())])
plt.contour(MU, S, Z.reshape(MU.shape), cmap=cm.Blues)
plt.xlabel("mu")
plt.ylabel("s")
