Dogelog player is a Prolog interpreter written 100% in Prolog that runs in JavaScript and Python. Its still a young software with only a few predefined predicates and evaluable functions. We recently added trigonometric functions and can demonstrate Turtle graphics. The precision of 64-bit floating point numbers should be enough for small examples.
Turtle Commands
The turtle commands are found in the Prolog text "turtle.p". This Prolog text is loaded by the main page "index.html" of the example together with the Dogelog player from "dogelog.js". The turtle commands were written in Prolog itself. The turtle has a state represented as dynamic facts:
:- dynamic current_angle/1.

:- dynamic current_position/2.
The turtle commands are turn/1, move/1 and line/1. As a side effect they not only change the turtle state but they might also emit SVG commands. This is the case for the line/1 command which will draw a line on a SVG port:
line(D) :-
   retract(current_position(X1,Y1)),
   current_angle(A),
   X2 is X1+D*cos(A),
   Y2 is Y1+D*sin(A),
   assertz(current_position(X2,Y2)),
   line_svg(X1,Y1,X2,Y2).
SVG Port
The SVG port is a deviation of the text port that we normally use to show Dogelog player substitution answers. Instead that we use a HTML text node, we now use a SVG graphics node. SVG is an XML based graphics format that already exists for a while and has quite some browser support:
<!-- p style="..." id="demo"></p -->
<svg id="demo" width="500" height="400"> </svg>
To be able to emit SVG commands to the SVG port we have to change the output routine of the Dogelog player slightly. Since the output will be XML we have to refrain from escaping it. Also it turned out that insertAdjacentHTML() is quite fast:
function out(buf) {
    // document.getElementById("demo").innerHTML += xml_escape(buf);
    document.getElementById("demo").insertAdjacentHTML("beforeend", buf);
}
Sierpinski Triangle
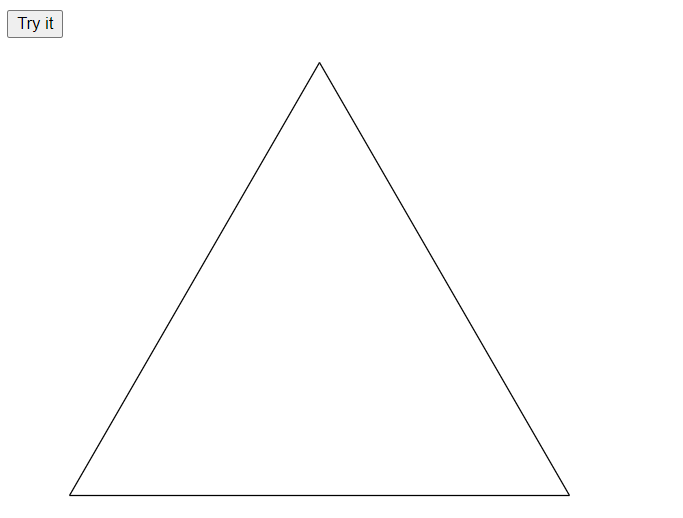
As an example we were drawing the Sierpinski triangle. The figure is a recursive fractal. The fractal can be drawn with a certain depth L. For depth L=0 only an equilateral triangle is drawn with length D. This can be done with Prolog by means of the turtle commands. The Prolog code is seen here:
sierpinski(D, 0) :- !, line(D), turn(-pi*2/3), line(D),
   turn(-pi*2/3), line(D), turn(pi*4/3).
The result will be a triangle as follows:
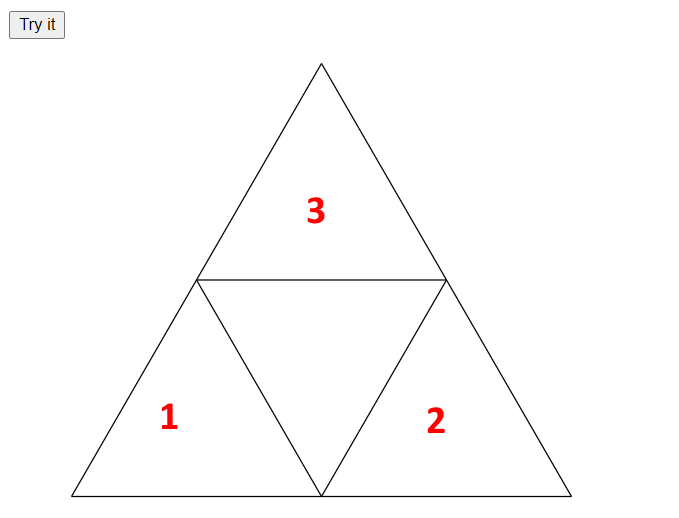
For depth L>0 the routine sierpinski/2 will call itself 3 times. It will first call for the left bottom, than for the right bottom and finally for the middle top. Between these invocations we move the turtle without drawing:
sierpinski(D, L) :- D1 is D/2, L1 is L-1,
   sierpinski(D1, L1), move(D1), sierpinski(D1, L1),
   turn(-pi*2/3), move(D1), turn(pi*2/3), sierpinski(D1, L1),
   turn(pi*2/3), move(D1), turn(-pi*2/3).
For depth L=1 the result will be, we have additionally numbered the recursive calls:
We first planned to include some speed parameter when drawing the Sierpinski triangle. But the current version of Dogelog player yields automatically around 60 times per second which gives a kind of animation by itself, since this yielding is currently clamped at 4ms by the browser. In a future version we might do it differently:
Conclusion
We could define some turtle commands in a Prolog text "turtle.p" and emit them to a SVG port. As an example we were drawing the Sierpinski triangle. The figure is a recursive fractal and by the way the asynchronous version of the Dogelog player is currently automatically yielding, we get a little animation.
Example 03: Turtle Graphics
http://www.xlog.ch/izytab/moblet/docs/18_live/10_reference/example04/package.html
Previous Post: Prolog Barber Paradox in JavaScript/Python
https://qiita.com/j4n_bur53/items/59128d9eeb61b86dd133