Introduction
We describe the implementation of a dynamical HTML page in Prolog that displays the moon phase seen from the northern hemisphere for a given day.

The code demonstrates a HTTP server addition to Dogelog Player, a Prolog system 100% written in Prolog itself available for the platforms JavaScript, Python and Java.
Synodic Month
The synodic month, or complete cycle of phases of the Moon as seen from Earth, averages 29.530588 mean solar days in length. The cycle was used by Meton (fl. 432 BC), an Athenian astronomer for a luni‐solar calendar.
We use epoch time in milliseconds as input to our calculations and calculate the moon phase as follows where 86400000 = 24*60*60*1000, i.e. the number of milliseconds in one day:
% phase(+Integer, -Float)
phase(T, N) :-
   D is T/86400000,
   P is (D - 6.5)/29.5305882,
   N is (P-truncate(P))*8.
A german description of the moon phase can be extracted by the following table and Prolog code:
% descr(+Integer, -Atom)
descr(1, R) :- !, R = 'Zunehmender Sichelmond'.
descr(2, R) :- !, R = 'Zunehmend Halbmond'.
descr(3, R) :- !, R = 'Zunehmend Dreiviertelmond'.
descr(4, R) :- !, R = 'Vollmond'.
descr(5, R) :- !, R = 'Abnehmend Dreiviertelmond'.
descr(6, R) :- !, R = 'Abnehmend Halbmond'.
descr(7, R) :- !, R = 'Abnehmend Sichelmond'.
descr(_, 'Neumond').
A Prolog query then gives us, where the wall statistics key is specific to Dogelog Player:
?- statistics(wall, T), phase(T, P),
    K is truncate(P+0.5), descr(K, D).
T = 1706027531173, P = 3.4556983476595633,
K = 3, D = 'Zunehmend Dreiviertelmond'.
We are now going to wrap the Prolog query into a HTML page reachable through a HTTP server. The HTTP server will do the computation and produce some HTML markup for a visualization.
Server Graphics
Our library(vector) provides a couple of SVG primitives. To show a moon and its sunlit portion, we use the SVG path primitive and an Arc path element.
% moon(+Stream, +Float)
moon(S, N) :-
   X is min(60,(N-2)*30), abs_flag(X, RX, SG),
   X2 is min(60,(6-N)*30), abs_flag(X2, RX2, SG2),
   svg_begin(S, [width(40),height(40)]),
   svg_rect(S, 0, 0, 200, 160, 'empy'),
   svg_circle(S, 100, 80, 60, 'dark'),
   svg_path(S, ['M',100,20,'A',RX,60,0,0,SG,100,140,
             'A',RX2,60,0,0,SG2,100,20,'Z'], 'light'),
   svg_end(S).

% abs_flag(+Float, -Float, -Integer)
abs_flag(X, RX, 1) :- X < 0, !, RX is -X.
abs_flag(X, X, 0).
Thanks to the new library(markup) the SVG primitives can be automatically pretty printed to an output stream. So that we can use a Prolog query to inspect the generate SVG markup:
?- current_output(S), dom_output_new(S, T),
   moon(T, 3.4556983476595633).
<svg style="width: 16.6667em; height: 13.3333em" viewBox="0 0 200 160">
   <rect x="0" y="0" width="200" height="160" class="empy"/>
   <circle cx="100" cy="80" r="60" class="dark"/>
   <path d="M 100 20 A 43.671 60 0 0 0 100 140 A 60 60 0 0 0 100 20 Z" class="light"/>
</svg>
The SVG rendering is not discretized into 8 different pictures, instead the above code will generate continuously varying graphics depending on the given floating point value.
HTML Page
By means of the library(spin) we wrote a HTTP server that does serve two pages /style.css and /moon.cgi . The style sheet /style.css is a static file served from the file system, it is used to give the SVG elements some styling such as a fill color:
dispatch('/style.css', _, _, Res) :-
   http_write_head(Res, 200,
        ['content-type'-'text/css; charset=utf-8']),
   http_text_new(Res, S),
   open('style.css', read, T),
   Etc..
The dynamic page /moon.cgi will present the description and present the sunlite portion in a page with forward and backward links. If the day is not given in the URL query parameters it will take the current day:
dispatch('/moon.cgi', List, _, Res) :-
   http_write_head(Res, 200,
       ['content-type'-'text/html; charset=utf-8']),
   http_text_new(Res, S),
   dom_output_new(S, T),
   (member(day - Day2, List) ->
      sys_time_atom('%Y-%m-%d', Time, Day2);
      statistics(wall, Time)),
   phase(Time, Phase),
Etc..
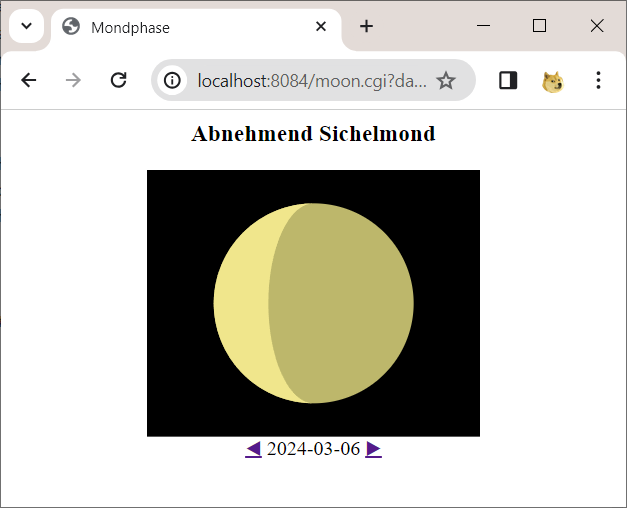
A link to the full code is given at the end of this post. The server can be run with either JavaScript where it will use node:http, or Python where it will use http_server or Java where it will use jdk.httpserver. Here is an example run:
The learning curve was not extremely high, since there is no need to generate a Prolog term, that would describe the output. The developer can freely interleave output statements and computation statements. As he is mostlikely already used when dealing with a TTY.
Conclusions
We spent one morning to create a dynamical HTML page, that shows the moon phase of a day via SVG. The coding is similar to how one is usually dealing with a TTY, lowering the learning curve. The single Prolog text can be used to serve the HTML page unchanged via JavaScript, Python or Java.
Dogelog Player Tutorial Examples
https://www.xlog.ch/izytab/doclet/docs/11_live/package.jsp