はじめに
決定木をコーディングしてみます。
決定木は色々なところで使われているイメージがあります。
「回帰」「分類」で利用することができます。
決定木の特徴は、得られた結果の意味を解釈しやすいところだと思います。
決定木はデータセットの特徴量に基づき「Yes」「No」で答えることができる質問をしていきます。
その「Yes」「No」がツリー上で表現されるため、結果の解釈がしやすいと言われています。
使用するデータ
使用するデータは、kaggleのHuman Resource DataSetを使います。
https://www.kaggle.com/rhuebner/human-resources-data-set
このデータの、HRDataset_v9.csvを使用します。
コーディング
import numpy as np
import pandas as pd
from sklearn import tree
from sklearn.tree import export_graphviz
from sklearn.model_selection import train_test_split
まずは各種インポートします。
df = pd.read_csv("human-resources-data-set/HRDataset_v9.csv")

# notebookの場合、columns数が多いと途中が省略されてしまうので、set_optionにて見れるcolumns数を変更しております。
pd.set_option('display.max_columns', 50)
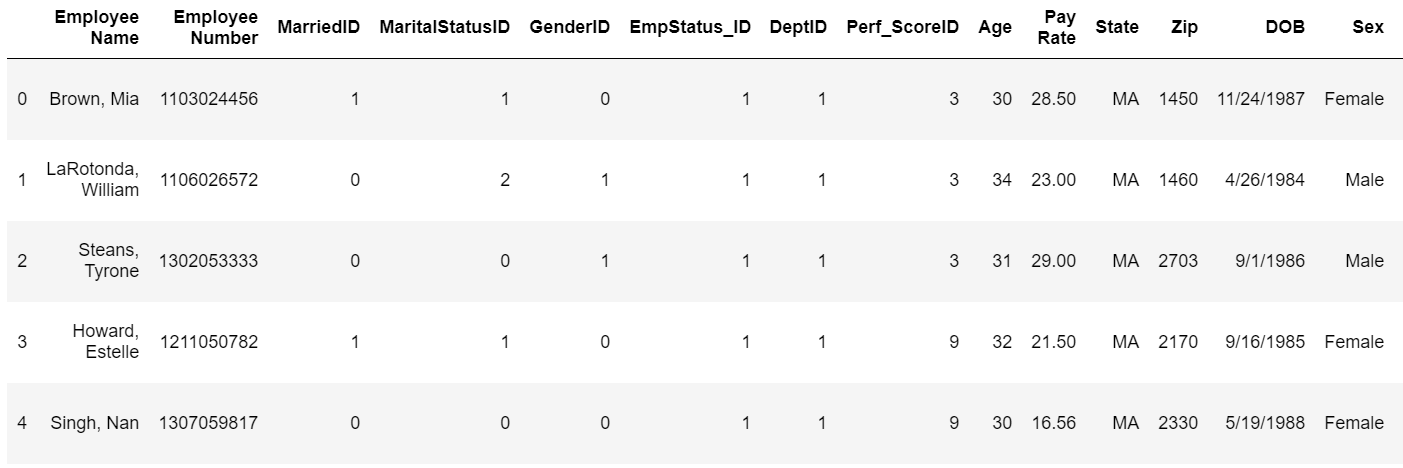
df.head()


決定木を使う場合は、使うデータはすべて数値データにする必要があります。したがって、文字列系のデータは数値に変換する必要があります。
また、実際に実務で使うデータには、想定外のデータや失われたデータの取り扱い方法についても考慮する必要があります。
今回の場合は、文字列系のデータが非常に多いのでバンバン消していきます。
del(df["Employee Name"],df["Employee Number"],
    df["EmpStatus_ID"],df["State"],df["DOB"],
    df["MaritalDesc"],df["CitizenDesc"],df["Hispanic/Latino"],
   df["RaceDesc"],df["Date of Hire"],
   df["Date of Termination"],df["Reason For Term"],
   df["Employment Status"],df["Department"],
   df["Position"],df["Manager Name"],df["Employee Source"],
   df["Performance Score"])

# 性別についてはカテゴリ変数に変換します。
# pd.Categoricalか、map関数を使って変換します。
# df["Sex"] = pd.Categorical(df.Sex).codes
d = {"Female":0,"Male":1}
df["Sex"] = df["Sex"].map(d)

# データを見てみます。
df.head()

データがとてもすっきりしました!
つぎに、決定木を構築するのに必要な特徴量を取り出します。つまりは説明変数や目的変数を設定します。
特徴変数:MarriedID以外
目的変数:GenderID,DeptID,Perf_ScoreID
としましょう。
y=df["MarriedID"]
features=df.drop(['MarriedID'],axis=1)
features=list(features.columns[1:4])
X=df[features]

# 別の方法
# features = list(df.columns[1:6])
# features.extend(list(df.columns[8:10]))
次に、trainデータとtestデータに分割,しfit関数によるモデルの作成を行います。
ついでにRandomForestもやってみます。
X_train,X_test,Y_train,Y_test = train_test_split(X,y,train_size=0.7)

tree_clf = tree.DecisionTreeClassifier().fit(X_train, Y_train)
ran = RandomForestClassifier().fit(X_train,Y_train)
print(tree_clf.score(X_test, Y_test))
print(ran.score(X_test,Y_test))
結果は以下の通りでした。
決定木:0.5376344086021505
ランダムフォレスト:0.5483870967741935
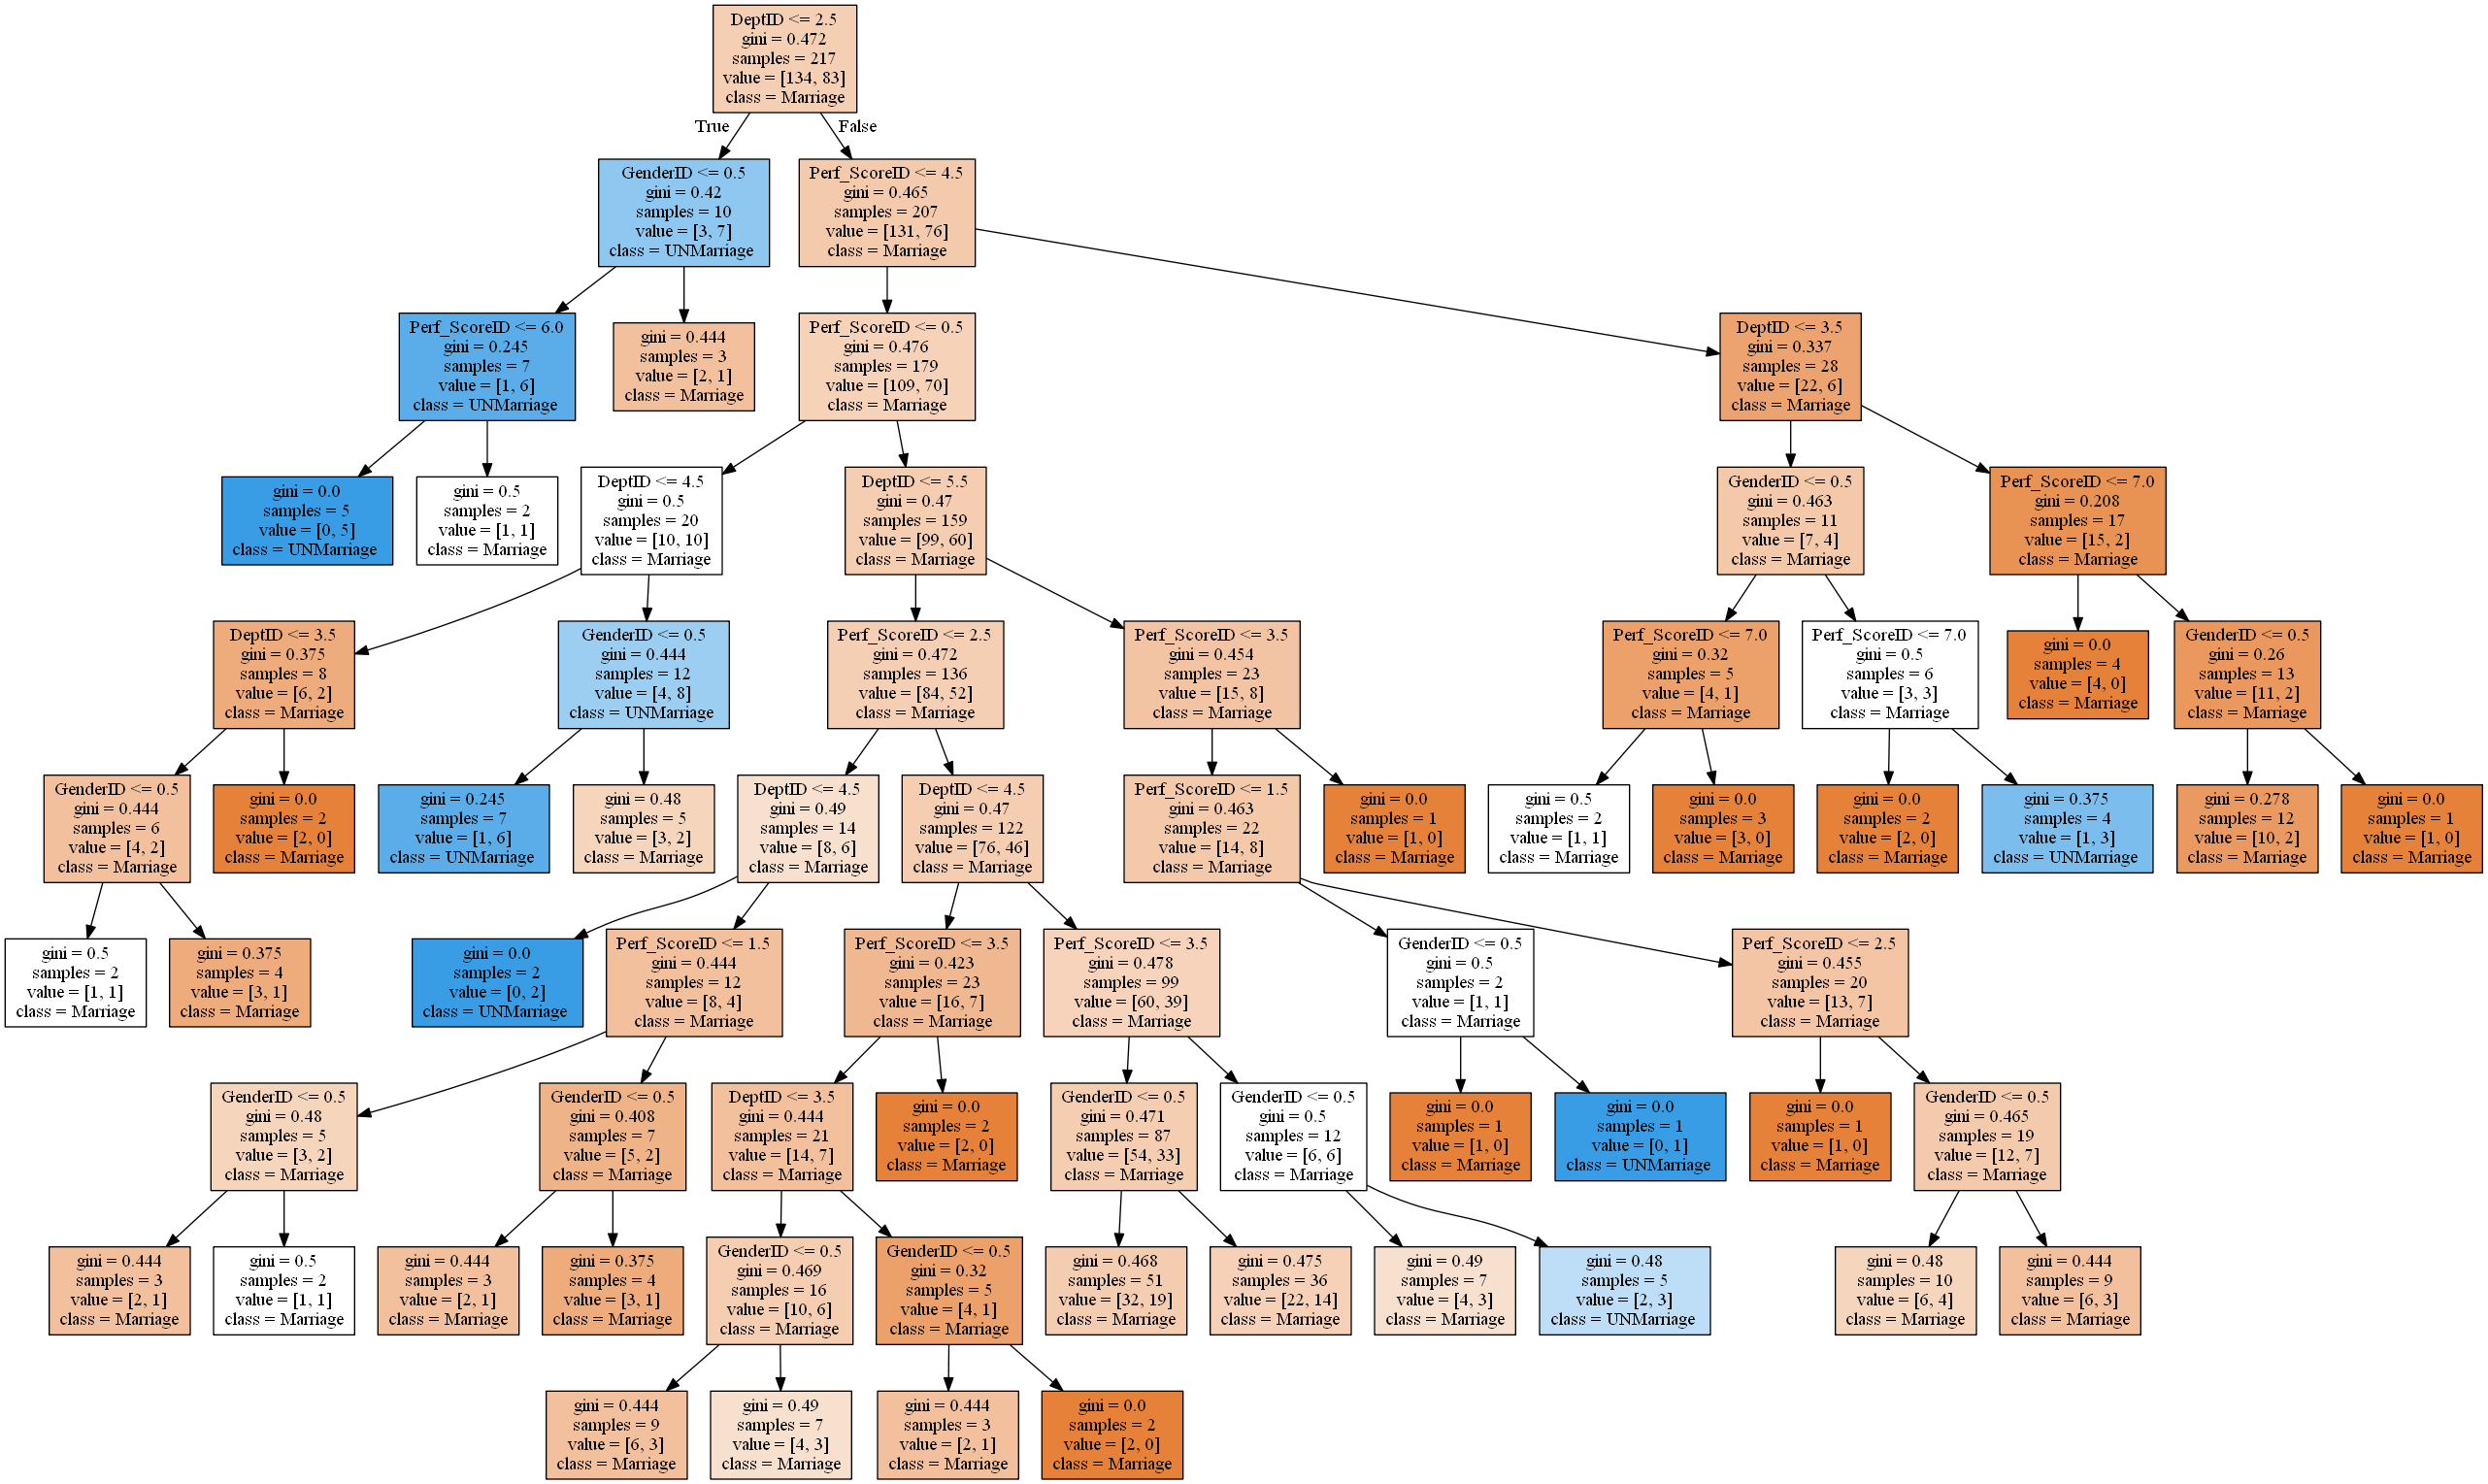
最後に可視化してみます。
python3の場合、pydotじゃなくてpydotplusにしたほうがいいです。pydotだとエラーが発生しました。
from IPython.display import Image
from sklearn.externals.six import StringIO
from pydotplus import graph_from_dot_data

dot_data = export_graphviz(
    tree_clf,
    filled=True,
    class_names=["Marriage","UNMarriage "],
    feature_names=features)

graph = graph_from_dot_data(dot_data)
display(Image(graph.create(format="png")))
結果は下記の通りです。
おわりに
pydotで2日ぐらい時間を費やしました...。プログラミングの大きな壁は、言語ではなくて環境構築だなと感じました。
class_names=["Marriage","UNMarriage "],の順番がこれで正しいのかわからないため、あとで確認してみる。また、出したグラフの解釈がいまいちわからないので、あとで確認しておくこと。
今回、この問題をするにあたって、説明変数をかなり多くとっていました。そうすると、score値がずっと1.0で、過剰適合しておりました。本当は説明変数が10個ぐらいありました。。。
この次はグリッドサーチとかを学んで最適なパラメータを推定していきたいと感じました。

