はじめに
こんにちは。いわっちと申します。qiita投稿2回目になります。情報系学部の学生です。
よろしくお願いします。
前回の投稿で、オフライン家計簿アプリの開発について躓いた箇所をご紹介させて頂いたのですが、今回の投稿もそのアプリの開発中の一部を切り取って皆さんにご紹介できることがあればと思いまして、投稿させて頂きたいと思います。
今回のテーマですが題名の通り、MPAndroidChartについてです。家計簿アプリで月ごとの収支がグラフのような形で確認できる機能が欲しいということでグラフを色々いじっておりました。
そこで、縦軸の目盛りに単位などを追加することに成功したのですが、勉強させて頂いたリファレンスが日本語ではなく英語を翻訳したようなものであったりで、日本語のリファレンスが見つからなかったので投稿してみようと思いました。
すでに日本語での解説が存在しておりましたらすみません。ww
ということで前置きが長くなってしまったので早速本題に入ります。
ちなみに、このオフライン家計簿アプリは商用とかでは全然なく、単に私の親戚のために開発しているアプリですww
普通にMPAndroidChartを利用する場合
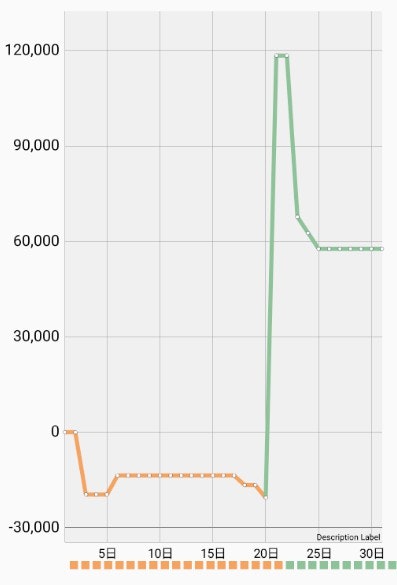
MPAndroidChartを利用する場合、通常は縦軸には数値のみが表示されてグラフに入っている数値データの値の大きさによって、表示する縦軸の数値が割り出され表示されていると思います。
普通にグラフを利用すると以下のような感じになるのではないでしょうか。

この画像は私の開発しているオフライン家計簿アプリのグラフになっています。
ソースは以下の通りです。今回の内容と関係ない余計なコードも載ってしまっており、見づらかったらすみません。
public class LineChart extends AppCompatActivity {

    private ArrayList<String> chartData;
    public com.github.mikephil.charting.charts.LineChart lineChart;

    @Override
    protected void onCreate(Bundle savedInstanceState){
        super.onCreate(savedInstanceState);
        setContentView(R.layout.activity_linechart);

        Intent intent = getIntent();
        chartData = intent.getStringArrayListExtra("chartData");

        lineChart = (com.github.mikephil.charting.charts.LineChart) findViewById(R.id.barchart);
        createBarChart();

        // グラフ表示
        lineChart.invalidate();
    }

    // グラフの設定をするメソッド createBarChart()
    private void createBarChart(){

        lineChart.getAxisRight().setEnabled(false);
        lineChart.getAxisLeft().setEnabled(true);
        lineChart.setDrawGridBackground(true);
        lineChart.setEnabled(true);

        lineChart.setTouchEnabled(true);
        lineChart.setPinchZoom(true);
        lineChart.setDoubleTapToZoomEnabled(true);

        lineChart.setScaleEnabled(true);

        lineChart.getLegend().setEnabled(true);

        HashMap<Integer, Integer> hashMap = new HashMap<>();
        int[] color = new int[31];

        int money = 0;
        for(int i=1;i<=31;i++){
            for(int j=0;j<chartData.size();j++){
                String[] data = chartData.get(j).split(",");
                String[] today = data[0].split("/");

                if(today[2].equals(String.valueOf(i))){
                    money = money + Integer.parseInt(data[2]);
                }
            }
            hashMap.put(i, money);
            if(money > 0) {
                color[i - 1] = R.color.colorGreen;
                if(i != 1)
                    color[i - 2] = R.color.colorGreen;
            }else {
                color[i - 1] = R.color.colorSandy;
                if(i != 1)
                    color[i - 2] = R.color.colorSandy;
            }
        }

        final List<Entry> entry = new ArrayList<>();
        for(int i=1;i<=31;i++){
            entry.add(new Entry(i, hashMap.get(i)));
        }

        LineDataSet data = new LineDataSet(entry, "金額");

        data.setColors(color, this);

        List<ILineDataSet> bars = new ArrayList<>();

        final String[] labels = {"", "1日", "2日", "3日", "4日"
                , "5日", "6日", "7日", "8日", "9日", "10日"
                , "11日", "12日", "13日", "14日", "15日", "16日"
                , "17日", "18日", "19日", "20日", "21日", "22日"
                , "23日", "24日", "25日", "26日", "27日", "28日"
                , "29日", "30日", "31日"};

        XAxis xAxis = lineChart.getXAxis();
        xAxis.setValueFormatter(new IndexAxisValueFormatter(labels));
        xAxis.setPosition(XAxis.XAxisPosition.BOTTOM);
        xAxis.setDrawGridLines(true);
        xAxis.setDrawLabels(true);
        xAxis.setTextSize(12);

        YAxis yAxis = lineChart.getAxisLeft();
        yAxis.setTextSize(15);

        data.setDrawValues(false);
        data.setLineWidth(4);
        data.setCircleRadius(2);
        data.setCircleColor(R.color.colorGray);

        bars.add(data);

        LineData barData = new LineData(bars);

        lineChart.setData(barData);

        //アニメーション
        lineChart.animateY(750, Easing.Linear);

        lineChart.getDescription().setEnabled(true);
        lineChart.setClickable(false);

    }
}
レイアウトはこのような感じになっております。
<?xml version="1.0" encoding="utf-8"?>
<android.support.constraint.ConstraintLayout xmlns:android="http://schemas.android.com/apk/res/android"
    android:layout_width="match_parent"
    android:layout_height="match_parent"
    xmlns:app="http://schemas.android.com/apk/res-auto"
    android:orientation="vertical">

    <View
        android:layout_width="wrap_content"
        android:layout_height="match_parent"
        android:id="@+id/flickView"
        app:layout_constraintRight_toLeftOf="@+id/barchart"/>

    <android.support.constraint.ConstraintLayout
        android:id="@+id/gridLayout"
        android:layout_width="match_parent"
        android:layout_height="wrap_content"
        app:layout_constraintEnd_toEndOf="parent"
        app:layout_constraintStart_toStartOf="parent"
        app:layout_constraintTop_toTopOf="parent"
        android:background="@color/colorGreen">

        <Button
            android:layout_width="0dp"
            android:layout_height="wrap_content"
            android:layout_gravity="left"
            android:background="@drawable/clear_button"
            android:onClick="EndChart"
            android:text="< 戻る"
            android:textColor="@color/colorWhite"
            android:textSize="13sp"
            android:minWidth="0dp"
            android:padding="10sp"
            app:layout_constraintStart_toStartOf="parent"
            app:layout_constraintTop_toTopOf="parent" />

        <TextView
            android:id="@+id/title"
            android:layout_width="wrap_content"
            android:layout_height="wrap_content"
            android:layout_gravity="center"
            android:paddingTop="10sp"
            android:textSize="20sp"
            android:text="月の収支の推移"
            android:textColor="@color/colorWhite"
            app:layout_constraintEnd_toEndOf="parent"
            app:layout_constraintStart_toStartOf="parent"
            app:layout_constraintTop_toTopOf="parent" />

    </android.support.constraint.ConstraintLayout>

    <TextView
        android:id="@+id/toDay"
        android:layout_width="wrap_content"
        android:layout_height="wrap_content"
        android:textSize="23sp"
        android:textColor="@color/colorGray"
        app:layout_constraintTop_toBottomOf="@+id/gridLayout"
        app:layout_constraintStart_toStartOf="parent"
        app:layout_constraintEnd_toEndOf="parent"
        app:layout_constraintBottom_toTopOf="@id/barchart"/>

<!---------------------ここの部分------------------------>
    <com.github.mikephil.charting.charts.LineChart
        android:id="@+id/barchart"
        android:layout_width="match_parent"
        android:layout_height="0dp"
        android:layout_marginBottom="20sp"

        app:layout_constraintBottom_toBottomOf="parent"
        app:layout_constraintEnd_toEndOf="parent"
        app:layout_constraintHorizontal_bias="1.0"
        app:layout_constraintStart_toStartOf="parent"
        app:layout_constraintTop_toBottomOf="@+id/toDay"
        app:layout_constraintVertical_bias="0.492" />
<!----------------------------------------------------->


</android.support.constraint.ConstraintLayout>
縦軸の目盛りに関しては、いじっていないので画像のように数値のみになってしまうと思います。
これに単位などの文字列を加えたい場合は以下のように編集します。
縦軸の目盛りに文字列を加えたグラフ
上のLineChart.javaのcreateBarChart()内に以下を追加すると、単位などの文字列を追加することができるようになります。
 lineChart.setRendererLeftYAxis(new YAxisRenderer(lineChart.getViewPortHandler(),
                       yAxis, lineChart.getTransformer(yAxis.getAxisDependency())){
            @Override
            protected void drawYLabels(Canvas c, float fixedPosition,
                                           float[] positions, float offset){
                final int from = mYAxis.isDrawBottomYLabelEntryEnabled() ? 0 : 1;
                final int to = mYAxis.isDrawTopYLabelEntryEnabled()
                        ? mYAxis.mEntryCount
                        : (mYAxis.mEntryCount - 1);

                // draw
                for (int i = from; i < to; i++) {
                    // -----------ここに文字を入れる------------------- //
                    String text = mYAxis.getFormattedLabel(i) + "円";

                    c.drawText(text, fixedPosition, positions[i * 2 + 1] + offset, mAxisLabelPaint);
                }
            }
        });
こちらのコメントアウトで示している部分に追加したい文字列を加えて実行すると縦軸にも単位などが表示されます。添付したコードには"円"を縦軸に追加しています。
fromやtoなどの引数がよく分からないので、このコードの全ての解説することができないのですが、setRendererLeftYAxis(new YAxisRenderer())を作成すると色々コードが自動生成されます。
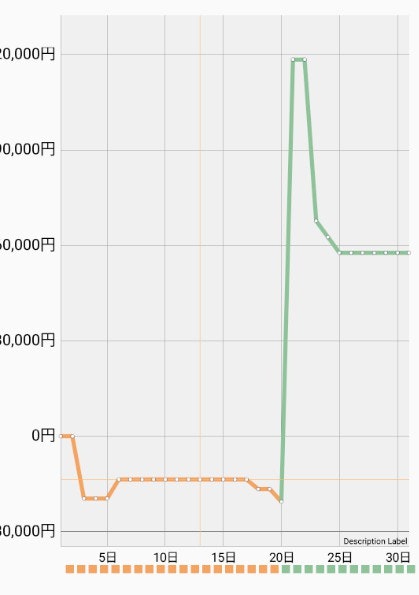
ですがこのまま追加して実行すると以下のように少しおかしい表示になってしまいます。

これは縦軸の目盛りの値が一文字追加されているのですが、このグラフの余白の部分に関しては"円"の追加を考慮していない余白設定であるため縦軸の目盛りが余白からはみ出てしまい、見切れてしまった事によるものです。
これを解消するためにさらにこちらのコードを追加しましょう。
lineChart.setExtraLeftOffset(lineChart.getExtraLeftOffset() + 30);
これは余白を設定するsetExtraLeftOffset()を利用しています。この余白を元々設定されている余白getExtraLeftOffset()に30を足しています。一文字の追加であればプラスする数値は30あたりが丁度いいです。2文字、3文字...と追加するのであればプラスする値も60、90...と設定しておくと丁度よくなると思います。
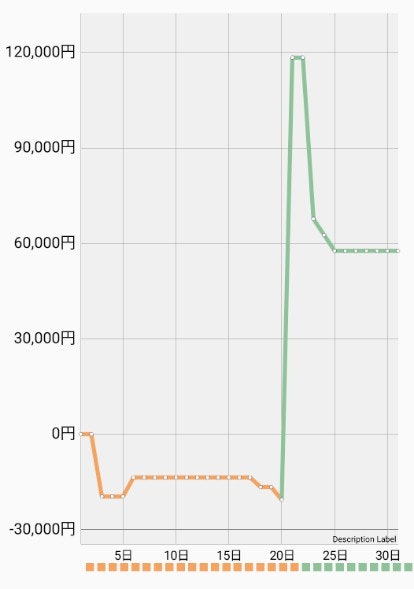
これで余白を設定してあげると全体でいい感じに表示されると思います。

この画像のように単位が書かれ、見栄えの良いグラフが完成いたしました。単位まで目盛りに書かれていると場合によっては非常に見やすく、わかりやすいのではないかと思います。
最終的なコードは以下のようになっています。
public class LineChart extends AppCompatActivity {

    private ArrayList<String> chartData;
    public com.github.mikephil.charting.charts.LineChart lineChart;

    @Override
    protected void onCreate(Bundle savedInstanceState){
        super.onCreate(savedInstanceState);
        setContentView(R.layout.activity_linechart);

        Intent intent = getIntent();
        chartData = intent.getStringArrayListExtra("chartData");

        lineChart = (com.github.mikephil.charting.charts.LineChart) findViewById(R.id.barchart);
        createBarChart();

        lineChart.invalidate();
    }

    private void createBarChart(){

        lineChart.getAxisRight().setEnabled(false);
        lineChart.getAxisLeft().setEnabled(true);
        lineChart.setDrawGridBackground(true);
        lineChart.setEnabled(true);

        lineChart.setTouchEnabled(true);
        lineChart.setPinchZoom(true);
        lineChart.setDoubleTapToZoomEnabled(true);

        lineChart.setScaleEnabled(true);

        lineChart.getLegend().setEnabled(true);
        // 追加コード
        lineChart.setExtraLeftOffset(lineChart.getExtraLeftOffset() + 30);

        HashMap<Integer, Integer> hashMap = new HashMap<>();
        int[] color = new int[31];

        int money = 0;
        for(int i=1;i<=31;i++){
            for(int j=0;j<chartData.size();j++){
                String[] data = chartData.get(j).split(",");
                String[] today = data[0].split("/");

                if(today[2].equals(String.valueOf(i))){
                    money = money + Integer.parseInt(data[2]);
                }
            }
            hashMap.put(i, money);
            if(money > 0) {
                color[i - 1] = R.color.colorGreen;
                if(i != 1)
                    color[i - 2] = R.color.colorGreen;
            }else {
                color[i - 1] = R.color.colorSandy;
                if(i != 1)
                    color[i - 2] = R.color.colorSandy;
            }
        }

        final List<Entry> entry = new ArrayList<>();
        for(int i=1;i<=31;i++){
            entry.add(new Entry(i, hashMap.get(i)));
        }

        LineDataSet data = new LineDataSet(entry, "金額");

        data.setColors(color, this);

        List<ILineDataSet> bars = new ArrayList<>();

        final String[] labels = {"", "1日", "2日", "3日", "4日"
                , "5日", "6日", "7日", "8日", "9日", "10日"
                , "11日", "12日", "13日", "14日", "15日", "16日"
                , "17日", "18日", "19日", "20日", "21日", "22日"
                , "23日", "24日", "25日", "26日", "27日", "28日"
                , "29日", "30日", "31日"};

        XAxis xAxis = lineChart.getXAxis();
        xAxis.setValueFormatter(new IndexAxisValueFormatter(labels));
        xAxis.setPosition(XAxis.XAxisPosition.BOTTOM);
        xAxis.setDrawGridLines(true);
        xAxis.setDrawLabels(true);
        xAxis.setTextSize(12);

        YAxis yAxis = lineChart.getAxisLeft();
        yAxis.setTextSize(15);
        // 追加コード
        lineChart.setRendererLeftYAxis(new YAxisRenderer(lineChart.getViewPortHandler(),
                              yAxis, lineChart.getTransformer(yAxis.getAxisDependency())){
            @Override
            protected void drawYLabels(Canvas c, float fixedPosition,
                                        float[] positions, float offset){
                final int from = mYAxis.isDrawBottomYLabelEntryEnabled() ? 0 : 1;
                final int to = mYAxis.isDrawTopYLabelEntryEnabled()
                        ? mYAxis.mEntryCount
                        : (mYAxis.mEntryCount - 1);

                // draw
                for (int i = from; i < to; i++) {

                    String text = mYAxis.getFormattedLabel(i) + "円";

                    c.drawText(text, fixedPosition, positions[i * 2 + 1] + offset, mAxisLabelPaint);
                }
            }
        });

        data.setDrawValues(false);
        data.setLineWidth(4);
        data.setCircleRadius(2);
        data.setCircleColor(R.color.colorGray);

        bars.add(data);

        LineData barData = new LineData(bars);

        lineChart.setData(barData);

        //アニメーション
        lineChart.animateY(750, Easing.Linear);

        lineChart.getDescription().setEnabled(true);
        lineChart.setClickable(false);

    }
}
おわりに
今回はPhilJayさんがご提供されておりますMPAndroidChartの一部のチューニングに関してご紹介させて頂きました。普通に利用すると、様々な設定が自動で割り当てられて細かい設定をせずともデータをぶち込んだだけで、そこそこの様になるグラフが出来上がってしまう非常に素晴らしいグラフです。
ですが、MPAndroidChartはグラフの隅々まで開発者自身での設定もすることができるらしく今回の紹介は、その詳細設定の中のごく一部分です。その他の細かい設定は、以下の参考文献でもご紹介されていらっしゃるので、ご覧になってみてはいかがでしょうか。
こちらの紹介が何かのご参考になれれば幸いです。
参考文献
この投稿を作成する際にこちらの方の文献で勉強させて頂きました。
・どのようにアンドロイドのmpchartのY軸のラベルを取得するには? - アンドロイド、チャート、棒グラフ、mpandroidchart
https://living-sun.com/ja/android/48833-how-to-get-y-axis-label-in-android-mpchart-android-charts-bar-chart-mpandroidchart.html
・MPAndroidChart/YAxisRenderer.java at master · PhilJay/MPAndroidChart · GitHub
https://github.com/PhilJay/MPAndroidChart/blob/master/MPChartLib/src/main/java/com/github/mikephil/charting/renderer/YAxisRenderer.java