はじめに
Lambdaのコールドスタートに苦しめられた経験はありませんか?
私が関わっているシステムではコールドスタート時のレスポンスタイムが課題でした。
コールドスタートを防ぐ手段としてProvisioned Concurrencyがあります。
Lambdaの実行環境を事前暖機しておきウォームスタートさせる機能です。
しかし、呼び出し毎に課金されるLambdaとは違い、呼び出されなくても事前暖機しておくだけでその数分課金されるため、未使用分コストが無駄にかかってしまうのが懸念点です。
そこで登場するのがApplication Auto Scalingです。
Provisioned Concurrencyの使用率に基づいて、事前暖機数がスケールされるため無駄なコストの発生を抑えることができます。
スケールには時間がかかるという情報があったため、スケール時間に関する検証を行いました。「スケール量が大きくなった場合、その分だけスケールにも時間がかかるのでは、リクエスト量の変動が大きいシステムでは使い物にならないのでは?」という懸念が湧いたため、その点に焦点を当てて検証を行いました。
結論
スケール量が大きくなってもスケールにかかる時間はあまり変わらないため、リクエスト量の変動の大きさはあまり気にしなくても良さそうです。
前提知識
Provisioned Concurrencyとは
前述したようにLambdaの実行環境を事前暖機させる仕組みです。事前暖機数分はウォームスタートで起動します。
事前暖機数以上のリクエストが発生した場合は通常のウォームスタートorコールドスタートで起動します。
詳細はこちら の「Provisioned Concurrency によるコールドスタートの削減」が分かりやすいと思います。
Application Auto Scalingとは
負荷に応じて自動でスケールさせることができる仕組みです。
AuroraやECSなど様々なサービスに適用できます。
Provisioned Concurrencyにも適用ができ、ProvisionedConcurrencyUtilizationというメトリクスを基準に事前暖機数がスケールされます。
こちらのスライド21〜29枚目が分かりやすいと思います。
検証方法
概要
以下、検証方法の概要図です。

リクエスト量の変動に伴う事前暖機数のスケール数とそのスケールにかかった時間を計測しました。
リソース作成
Lambda中身
Lambdaは20秒待って、レスポンスを返すだけです。
実行時間が長い方が同時実行数が安定するので、20秒のスリープを入れました。
import json
import time

def lambda_handler(event, context):

    time.sleep(20)
    return {
        "statusCode": 200,
        "body": json.dumps({
            "message": "Provisioned Concurrency"
        }),
    }
Provisioned Concurrency 設定(SAM)
SAMを用いてデプロイしました。以下デプロイの際に使用したtemplate.ymlです。
スケールの最小値,最大値,スケール基準をそれぞれ3, 500, 0.50に設定しています。
AWSTemplateFormatVersion: '2010-09-09'
Transform: AWS::Serverless-2016-10-31
Description: >
  sam-provisioned-concurrency

Globals:
  Function:
    Timeout: 25

Resources:
  # Lambdaの設定
  MyFunction:
    Type: AWS::Serverless::Function
    Properties:
      FunctionName: my-function-name
      CodeUri: hello_world/
      Handler: app.lambda_handler
      Runtime: python3.12
      Architectures:
        - x86_64
      Events:
        HelloWorld1:
          Type: Api
          Properties:
            Path: /hello
            Method: get
      AutoPublishAlias: live
      ProvisionedConcurrencyConfig:
        ProvisionedConcurrentExecutions: 3 # 初期値

  # Application Auto Scaling の設定
  MyScalableTarget:
    Type: AWS::ApplicationAutoScaling::ScalableTarget
    Properties:
      MaxCapacity: 500 # 最大値
      MinCapacity: 3 # 最小値
      ResourceId: !Sub function:${MyFunction}:live
      RoleARN: !Sub arn:aws:iam::${AWS::AccountId}:role/aws-service-role/lambda.application-autoscaling.amazonaws.com/AWSServiceRoleForApplicationAutoScaling_LambdaConcurrency
      ScalableDimension: lambda:function:ProvisionedConcurrency
      ServiceNamespace: lambda
    DependsOn: MyFunctionAliaslive
  MyTargetTrackingScalingPolicy:
    Type: AWS::ApplicationAutoScaling::ScalingPolicy
    Properties:
      PolicyName: utilization1
      PolicyType: TargetTrackingScaling
      ScalingTargetId: !Ref MyScalableTarget
      TargetTrackingScalingPolicyConfiguration:
        TargetValue: 0.50 # スケール基準
        PredefinedMetricSpecification:
          PredefinedMetricType: LambdaProvisionedConcurrencyUtilization

Outputs:
  HelloWorldApi:
    Description: "API Gateway endpoint URL for Prod stage for Hello World function"
    Value: !Sub "https://${ServerlessRestApi}.execute-api.${AWS::Region}.amazonaws.com/Prod/hello/"
デプロイするとLambda,API Gateway,Provisioned Concurrncy設定がされます。
Provisioned Concurrncy設定はCloudShellでAPIを叩けば確認できます。
~ $ aws application-autoscaling describe-scalable-targets --service-namespace lambda
{
    "ScalableTargets": [
        {
            "ServiceNamespace": "lambda",
            "ResourceId": "function:my-function-name:live",
            "ScalableDimension": "lambda:function:ProvisionedConcurrency",
            "MinCapacity": 3,
            "MaxCapacity": 500,
            "RoleARN": "arn:aws:iam::xxxxxxxxxxxx:role/aws-service-role/lambda.application-autoscaling.amazonaws.com/AWSServiceRoleForApplicationAutoScaling_LambdaConcurrency",
            "CreationTime": "2025-02-09T06:52:09.089000+00:00",
            "SuspendedState": {
                "DynamicScalingInSuspended": false,
                "DynamicScalingOutSuspended": false,
                "ScheduledScalingSuspended": false
            },
            "ScalableTargetARN": "arn:aws:application-autoscaling:ap-northeast-1:xxxxxxxxxxxx:scalable-target/xxxxxxxxxxxx"
        }
    ]
}
~ $ aws application-autoscaling describe-scaling-policies --service-namespace lambda
{
    "ScalingPolicies": [
        {
            "PolicyARN": "arn:aws:autoscaling:ap-northeast-1:xxxxxxxxxxxx:scalingPolicy:xxxxxxxxxx:resource/lambda/function:my-function-name:live:policyName/utilization1",
            "PolicyName": "utilization1",
            "ServiceNamespace": "lambda",
            "ResourceId": "function:my-function-name:live",
            "ScalableDimension": "lambda:function:ProvisionedConcurrency",
            "PolicyType": "TargetTrackingScaling",
            "TargetTrackingScalingPolicyConfiguration": {
                "TargetValue": 0.5,
                "PredefinedMetricSpecification": {
                    "PredefinedMetricType": "LambdaProvisionedConcurrencyUtilization"
                }
            },
            "Alarms": [
                {
                    "AlarmName": "TargetTracking-function:my-function-name:live-AlarmHigh-xxxxxxxxxxxx",
                    "AlarmARN": "arn:aws:cloudwatch:ap-northeast-1:xxxxxxxxxxxx:alarm:TargetTracking-function:my-function-name:live-AlarmHigh-xxxxxxxxxxxx"
                },
                {
                    "AlarmName": "TargetTracking-function:my-function-name:live-AlarmLow-xxxxxxxxxxxx",
                    "AlarmARN": "arn:aws:cloudwatch:ap-northeast-1:xxxxxxxxxxxx:alarm:TargetTracking-function:my-function-name:live-AlarmLow-xxxxxxxxxxxx"
                }
            ],
            "CreationTime": "2025-02-09T06:52:21.751000+00:00"
        }
    ]
}
上記の2個目のコマンドで出力された"Alarms"は、CloudWatchアラームです。
スケールアップ(AlarmHigh)とスケールダウン(AlarmLow)2種類のアラームが設定されます。
このアラームが発火するとAutoScalingが走り、Provisioned Concurrencyによる事前暖機数がスケールされるという仕組みです。
負荷のかけ方
Locustを用いて負荷をかけました。
クライアント
普通にリクエストを投げて、Lambda内のスリープ時間である20秒後にレスポンスを受け取ったらまたリクエストを投げるという設定です。
class Test_Client(HttpUser):

    @task
    def test(self):
        with self.client.get('/Prod/hello/', catch_response = True) as response:
            response_body = json.loads(response.text)
            errors = response_body.get('errors')
            if not errors:
                print(response_body)
                response.success()
            else:
                response.failure('{}'.format(errors.get('code')))
負荷の制御
LoadTestShapeを用いてリクエストするユーザ数を変動させることにより、負荷を変動させました。
class StagesShape(LoadTestShape):
    stages = [
        {"duration": 600, "users": 2, "spawn_rate": 2},     # 0〜10分は ユーザ数:2
        {"duration": 1200, "users": 4, "spawn_rate": 4},    # 10〜20分はユーザ数:4
        {"duration": 1800, "users": 8, "spawn_rate": 8},    # 20〜30分はユーザ数:8
        {"duration": 2400, "users": 16, "spawn_rate": 16},  # 30〜40分はユーザ数:16
        {"duration": 3000, "users": 32, "spawn_rate": 32},  # 40〜50分はユーザ数:32
        {"duration": 3600, "users": 64, "spawn_rate": 64},  # 50〜60分はユーザ数:64
        {"duration": 4200, "users": 128, "spawn_rate": 128} # 60〜70分はユーザ数:128 70分以降は0
        ]

    def tick(self):
        run_time = self.get_run_time()

        for stage in self.stages:
            if run_time < stage["duration"]:
                tick_data = (stage["users"], stage["spawn_rate"])
                return tick_data

        return None
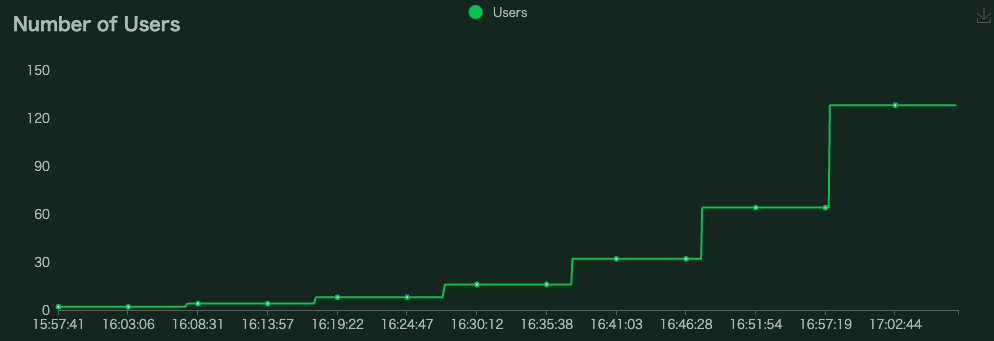
上記設定により、以下のようにユーザ数を自動で変動させることが出来ます。
データ取得
GetProvisionedConcurrencyConfig APIによってProvisioned Concurrencyに関するメトリクスを取得しました。
このAPIで取得できるメトリクスのうち、今回の検証では以下のメトリクスを用いて分析しました(分析内容は後述「検証結果」に記載)。
・RequestedProvisionedConcurrentExecutions
リクエストされたプロビジョニング済み同時実行数
・AvailableProvisionedConcurrentExecutions
使用可能なプロビジョニング済み同時実行数
上記メトリクスはCloudWatchメトリクスのようにマネコン上で時系列データとして確認する方法がなさそうだったので、1秒ごとにAPIを叩いてメトリクスを取得し、取得したデータを保存するプログラムを作成しました。
import boto3
import time
import csv
from datetime import datetime, timezone, timedelta

'''
【注意】
以下のグローバル変数を設定してから始める
'''
# メトリクス取得間隔, 計測時間
GET_INTERVAL_SECOND = 1
MEASUREMENT_TIME_SECOND = 4800
# AutoScalingのパラメータ
TARGET_VALUE = 0.50
MIN = 3
MAX = 500
# 計測対象の関数, エイリアス
FUNCTION_NAME = 'my-function-name'
QUALIFIER = 'live'

def save_file(response_list):
    jst_now = datetime.now(timezone(timedelta(hours = +9)))
    """ファイル出力処理"""
    with open(f'{MIN}_{MAX}_{TARGET_VALUE}_{FUNCTION_NAME}_{jst_now}.csv', 'w', newline='') as csvfile:
        # ヘッダー行
        header_list = [
            'Timestamp',
            'RequestedProvisionedConcurrentExecutions',
            'AvailableProvisionedConcurrentExecutions',
            'AllocatedProvisionedConcurrentExecutions',
            'Status',
            'StatusReason',
            'LastModified'
            ]
        writer = csv.DictWriter(csvfile, fieldnames = header_list)
        writer.writeheader()
        writer.writerows(response_list)


def call_get_provisioned_concurrency_config_API():
    """get_provisioned_concurrency_config API を呼び出し、レスポンスを取得する"""
    lambda_client = boto3.client('lambda')
    response = lambda_client.get_provisioned_concurrency_config(
      FunctionName = FUNCTION_NAME,
      Qualifier = QUALIFIER
    )
    return response


if __name__ == '__main__':
    start_time = time.perf_counter()
    target_time = start_time
    response_list = []
    try:
        while True:
            # GET_INTERVAL_SECONDごとにデータ取得するための記述
            while time.perf_counter() < target_time:
                pass
            target_time += GET_INTERVAL_SECOND
            # API を呼び出す
            jst_now = datetime.now(timezone(timedelta(hours = +9))) # 取得時間を記録
            response = call_get_provisioned_concurrency_config_API()
            del response['ResponseMetadata']
            # 日本時間をタイムスタンプとして記録
            response['Timestamp'] = jst_now.strftime('%Y-%m-%d %H:%M:%S.%f')
            # レスポンスを結果配列に追加
            response_list.append(response)
            print(response)
            # 指定計測時間経ったらfinallyへ
            if time.perf_counter() - start_time >= MEASUREMENT_TIME_SECOND:
                print(f'{MEASUREMENT_TIME_SECOND}秒経ちました。')
                break
    except KeyboardInterrupt:
        print('Ctrl+Cが押されました。')
    finally:
        print('ファイルを保存するまでお待ちください。')
        # CSV ファイルに書き込む
        save_file(response_list)
        print('ファイルを保存しました。')
「MEASUREMENT_TIME_SECONDで設定した秒数が経つ」 or 「Ctrl + c 押下」 するとファイルを保存して終了する仕様です。
検証結果
以下グラフより、LocustのUsersが増加するにつれ、AvailableProvisionedConcurrentExecutionsが上にスケールされていることがわかります。
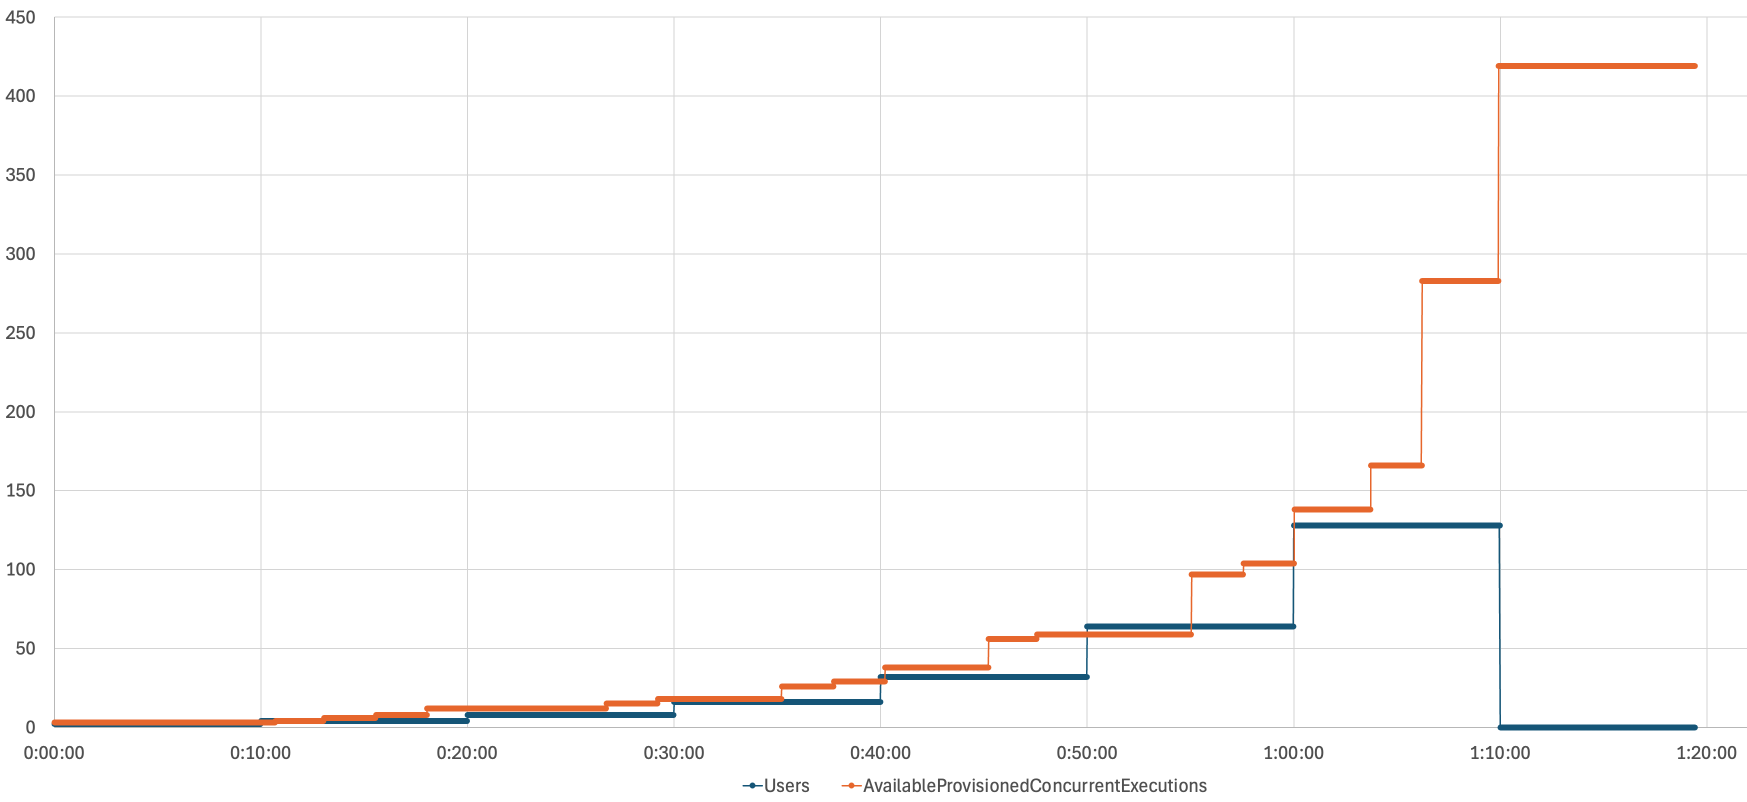
また以下グラフより、事前暖機数のスケールアップのリクエストがあってから(RequestedProvisionedConcurrentExecutionsの値が変動するタイミング)、利用できる事前暖機数(AvailableProvisionedConcurrentExecutions)が実際にその値にスケールされるには少し時間がかかることがわかります。

この際のスケールアップ量(=Requested変動時のRequestedとAvailableの差分)とリクエストされてから実際にスケールされるまでの時間(=RequestedとAvailableが同じになるまでにかかる時間)の関係は以下のグラフのようになりました。

直線は近似曲線です。
スケール量が10倍になったらスケールにかかる時間も10倍になるというようなことはなく、スケールにかかる時間はあまり変わらないことがわかります。
おわりに
スケール量に対しスケールにかかる時間はあまり変わらないため、リクエスト数の変動の大きさに関わらずProvisioned Concurrency のApplication Auto Scalingは効力を発揮しそうです。