概要
ZabbixAgent2では、Systemdサービスの稼働状態をチェックできるらしい。
systemdユニットの起動状態を確認するために、Zabbix_Agent2をインストールし、監視を行う。
これにより、独自のサービスでも稼働状態を監視できる。
参考サイト
環境
監視対象サーバ:CentOS7
ZabbixServer:Version5.5
監視対象サーバは、ポート10050が空いているものとする。
手順
ZabbixAgent2のインストール
以下のコマンドを監視対象で実行し、Zabbixのリポジトリをインストールする。以下のコマンドは、centos7用のリポジトリをインストールしている。
sudo rpm -Uvh https://repo.zabbix.com/zabbix/6.2/rhel/7/x86_64/zabbix-
release-6.2-3.el7.noarch.rpm
以下のコマンドを実行し、yumのキャッシュを削除する。
sudo yum clean all
以下のコマンドを実行し、エージェントインストールを行う。
sudo yum install zabbix-agent2 zabbix-agent2-plugin-*
完了しました!と出れば問題なし。
既にZabbixエージェントが起動している場合(ない場合はスキップ)
以下のコマンドで、既存のZabbixエージェントをアンインストールする。
ZabbixAgentが起動していると、ZabbixAgent2は起動できないため
sudo dnf remove zabbix-agent
もしくは
sudo yum remove zabbix-agent
zabbix_agentd2.confの設定と起動
/etc/zabbix/zabbix_agent2.confを編集し、接続先などの設定を行う。
sudo vi /etc/zabbix/zabbix_agent2.conf
Server=の右側に、ZabbixServerのIPアドレスを記載する。下記例では、192.168.162.242
# Server=
Server=192.168.162.242
### Option: ListenPort
#       Agent will listen on this port for connections from the server.
#
# Mandatory: no
また、Hostnameの右側に、ホスト名を記載する。下記例では、SV0066
# Hostname=
Hostname=SV0066
### Option: HostnameItem
#       Item used for generating Hostname if it is undefined. Ignored
if Hostname is defined.
編集が終わったら、以下のコマンドでZabbixAgent2を再起動させる。
また、自動起動するように設定しておく。
sudo systemctl restart zabbix-agent2.service
sudo systemctl enable zabbix-agent2
ブラウザでの操作
既にZabbixAgentでホストを登録していた場合は、ブラウザの管理画面にアクセスしてエージェントの状態をみる事が可能。緑であれば、問題なく取得できている。
ホストの登録(既に登録されている場合は不要)
設定/ホスト/ホストの作成をクリック

- ホスト名(ここではSV0066)
- グループ (好きなグループ)
- インターフェース(監視対象のIPアドレス:ここでは192.168.162.243)

テンプレートの欄で、テンプレートをリンクさせ、追加を押す。*ここでは、Template OS Linux とする。

その後、最新データから監視対象のホストを検索し、監視項目のデータが取れている事を確認する

Systemdの監視
ここからが本題です。さきほど登録したSV0066を、設定/ホスト/アイテムから選択します。

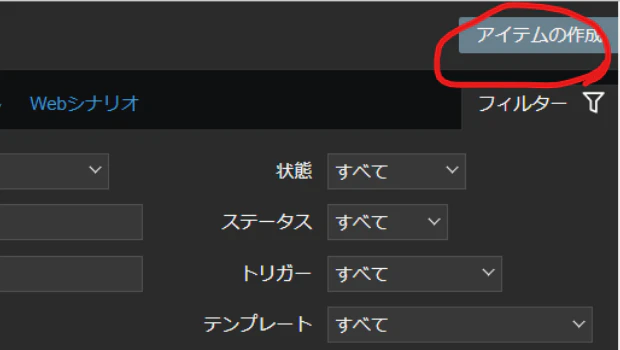
アイテムの作成
右側にあるアイテムの作成をクリック
以下のように設定を行う。今回変更していない項目にも変更がある場合は、適宜調整すること。
- 名前
- httpd service is running
- タイプ
- Zabbixエージェント
- キー
- systemd.unit.info[httpd.service]
- []内は、監視対象のサーバで起動しているサービス名
- データ型
- 文字列
- アプリケーションの作成
- Httpd Service
実行できたら、一番下の追加を押す。

- Httpd Service
トリガーの作成
アイテムの右にあるをクリックし、右側にあるトリガーを作成を押す。

そして、今回以下のような形式でトリガーを追加する。(深刻度などに関しては、用件に応じて致命的な障害や軽度の障害に変更すること。)
- 名前
httd service is down on {HOST.NAME}
- 深刻度
- 重度の障害
- 条件式
-
{SV0066:systemd.unit.info[httpd.service].last()}<>"active"- SV0066の部分は、監視対象のホスト名。ここではSV0066
- []内は、監視予定のサービス名。ここではhttpd.service
-
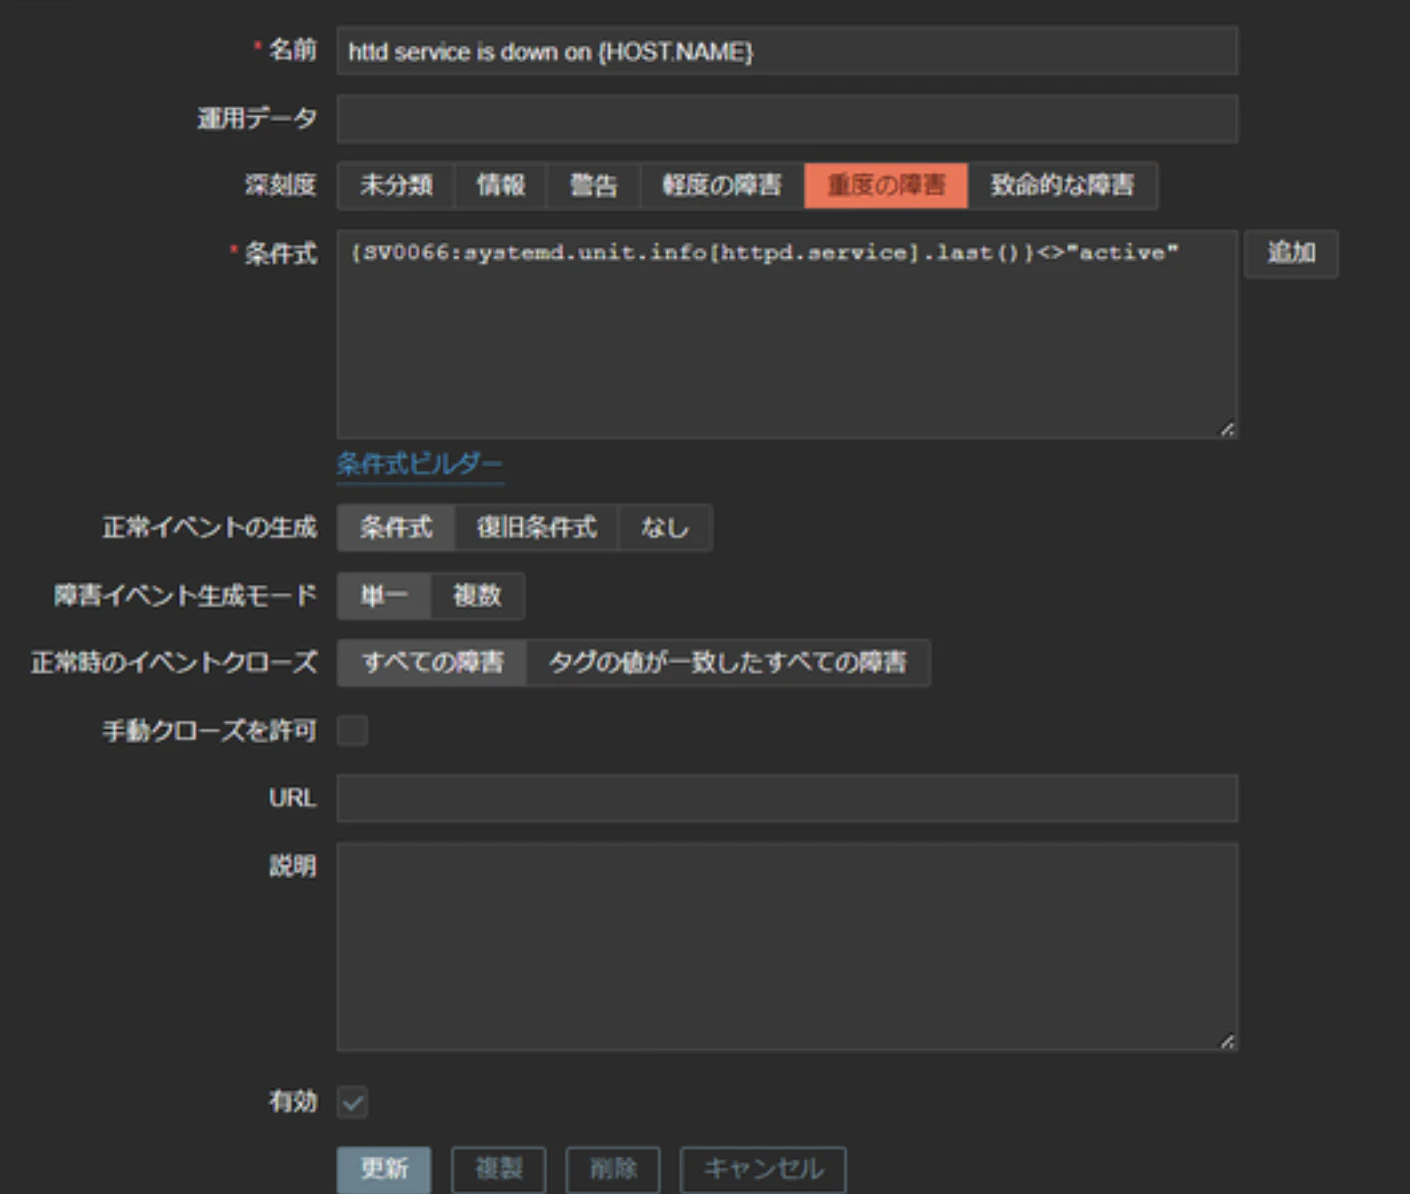
設定できたら、下にある追加を押す。
正常に起動できたら、設定したトリガーが正常に稼働しているのが分かる。
また、アイテム欄からhttpd service is runningを選択して、値の取得とテストを実行してみても良い。
発報テスト
監視対象のホストで、httpd serviceを停止させてみる。
sudo systemctl stop httpd
管理画面を確認してみると、httpdのサービスが落ちたことによる、重度の障害が検知されている。

確認できたら、以下のコマンドでhttpdサービスを復帰させる
sudo systemctl start httpd
すると、障害の部分が消え、解決済みになったのが確認できた。
