はじめに
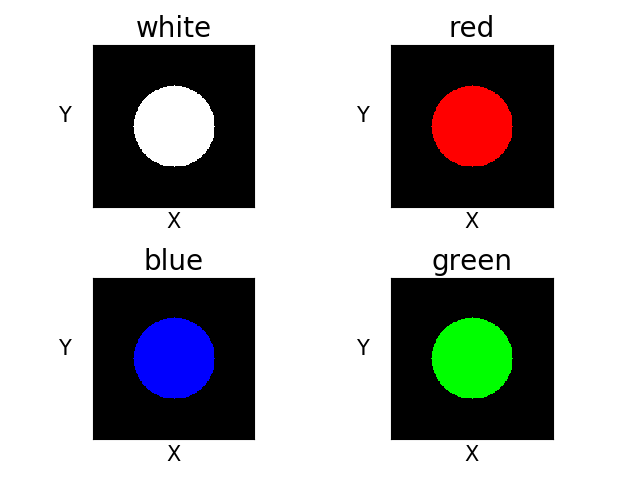
Matplotlibで複数の図をまとめて表示するという記事は多くあります。しかし、複数の図にタイトルを付けるという内容は少なかったので記事にしました。
方法
plot.py
# ライブラリを読み込む
import numpy as np
import cv2
import matplotlib.pyplot as plt

# 円を描画(白、赤、緑、青)
white = cv2.circle(np.zeros((200, 200, 3), dtype=np.uint8), (100, 100), 50, (255, 255, 255), thickness = -1)
red = cv2.circle(np.zeros((200, 200, 3), dtype=np.uint8), (100, 100), 50, (0, 0, 255), thickness = -1)
green = cv2.circle(np.zeros((200, 200, 3), dtype=np.uint8), (100, 100), 50, (0, 255, 0), thickness = -1)
blue = cv2.circle(np.zeros((200, 200, 3), dtype=np.uint8), (100, 100), 50, (255, 0, 0), thickness = -1)

# タイトル
titles = ['white', 'red', 'blue', 'green']

# グラフをリストの入れ子にする
graphs = [white, red, blue, green]

# 表示領域を設定(行,列)
fig, ax = plt.subplots(2, 2)

# 図を配置
for i in range(0,4):
    plt.subplot(2,2,i+1)
    plt.title(titles[i], fontsize=20)    #タイトルを付ける
    plt.tick_params(color='white')      #メモリを消す
    plt.tick_params(labelbottom=False, labelleft=False, labelright=False, labeltop=False)
    plt.imshow(cv2.cvtColor(graphs[i], cv2.COLOR_BGR2RGB))   #図を入れ込む
    plt.xlabel('X', fontsize=15)        #x軸に名前をつける
    plt.ylabel('Y', rotation=0, fontsize=15, labelpad=20) #y軸に名前をつける

# 図が重ならないようにする
plt.tight_layout()

# 図を表示
plt.show()
おわりに
ご覧いただきありがとうございました。ご指摘等ありましたらコメント欄にお願いします。
参考URL
https://openbook4.me/sections/1396
(閲覧: 2020年3月2日)
