プロットしたいNaNの入ったCSVデータ
下記のような不等間隔な時刻ごとのデータが入ったCSVファイルのデータをプロットしたいとします。
bar1からbar4がデータ。途中で抜けがあります。
| time | data1 | data2 | data3 | data4 |
|---|---|---|---|---|
| 0 | 449 | 449 | 445 | 440 |
| 510.1 | 445 | 442 | ||
| 530.1 | 420 | |||
| 730.1 | 410 | |||
| 1430.1 | 412 | 425 | 424 | 421 |
これをそのままプロットすると、空白部分でmatplotlibの線が切れて、ブチブチのグラフになります。
直線でつながるようにしたって話です。
そのままデータフレームにしてプロットしてみる
import pandas as pd
df = pd.read_csv("data.csv")
print(df)
なにも考えずにread_csvでデータフレームに入れると、空白部分がNaNになります。
| time | data1 | data2 | data3 | data4 | |
|---|---|---|---|---|---|
| 0 | 0.0 | 449.0 | 449.0 | 445.0 | 440.0 |
| 1 | 510.1 | NaN | NaN | 445.0 | 442.0 |
| 2 | 530.1 | 420.0 | NaN | NaN | NaN |
| 3 | 730.1 | NaN | 410.0 | NaN | NaN |
| 4 | 1430.1 | 412.0 | 425.0 | 424.0 | 421.0 |
import matplotlib.pyplot as plt
markers1 = ["d", "o", "v", "^", "<", ">", "1", "2", "3",
            "4", "8", "s", "p", "*", "h", "H",  "x", "D", "|", ","]
fig0 = plt.figure(figsize=(8.2,8))
ax = fig0.add_subplot(111)

ax.set_ylim(390,450)

for i in range(4):
    ax.plot(df["time"], df["data"+str(i+1)], marker=markers1[i], label="data"+str(i+1))
ax.legend(bbox_to_anchor=(1.01, 1., 0., 0), loc='upper left', borderaxespad=0.,)
それをmatplotlibでプロットすると線が切れて表示されます。全部つないでほしい。
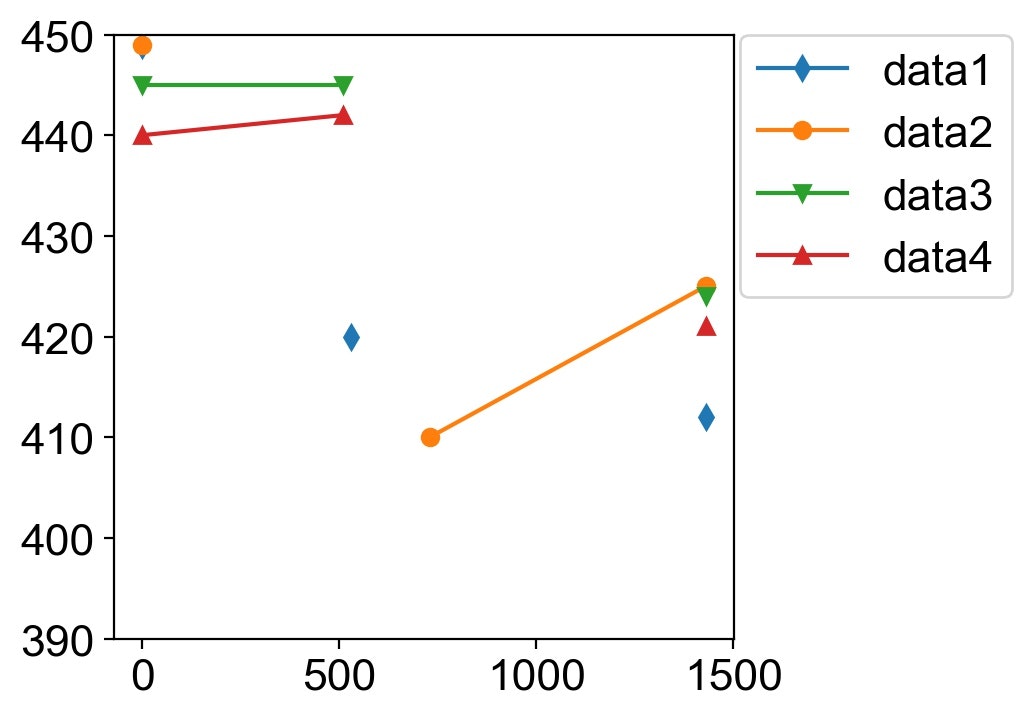
どうするか?
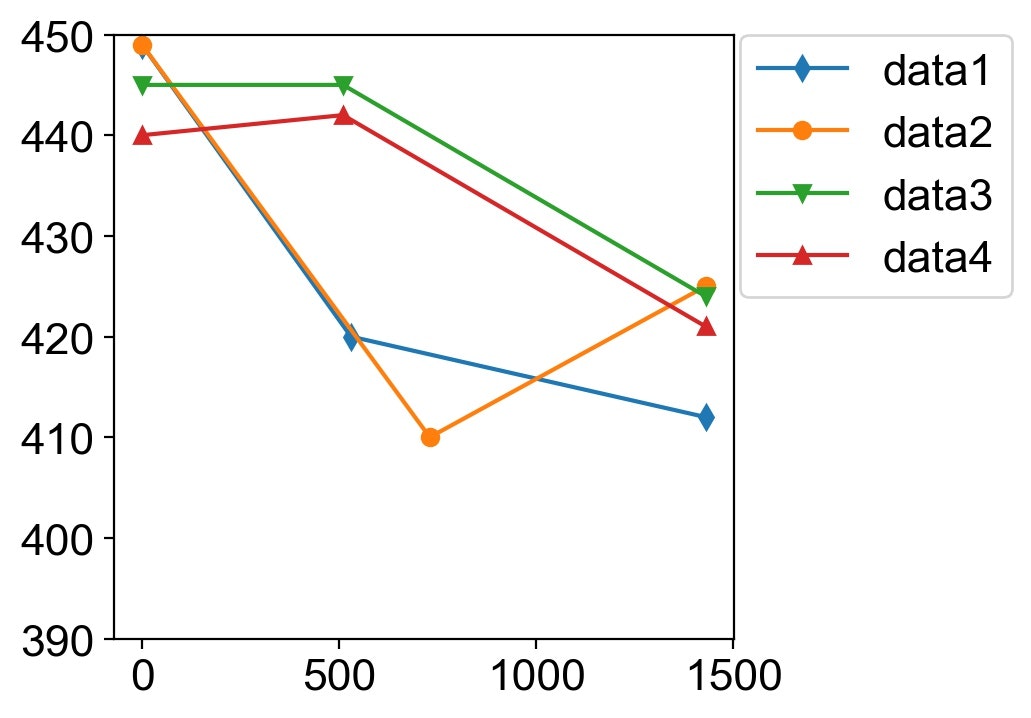
プロットする段階でNaNをdropnaで削除してからプロットします。"time"列のデータは全部埋まっていて、dropnaで消えないので、予めindexにしておきます。
df = pd.read_csv("data.csv",index_col=0)

fig0 = plt.figure(figsize=(8.2,8))
ax = fig0.add_subplot(111)

ax.set_ylim(390,450)

for i in range(4):
    ax.plot(df["bar"+str(i+1)].dropna(how='any'), marker=markers1[i], label="data"+str(i+1))

ax.legend(bbox_to_anchor=(1.01, 1., 0., 0), loc='upper left', borderaxespad=0.,)
つながりました。
補足
- ちなみにgnuplotでやると、最初のCSVをプロットしただけで、そのまま全部つないでくれました。
- データフレームのinterpolateでやると、NaNは無視して補間してくれますが、time列のデータ間隔を反映して補間するなんてことはしないので、今回の場合は適用できません。
print(pd.read_csv("data.csv").interpolate())
| time | data1 | data2 | data3 | data4 | |
|---|---|---|---|---|---|
| 0 | 0.0 | 449.0 | 449.0 | 445.0 | 440.0 |
| 1 | 510.1 | 434.5 | 436.0 | 445.0 | 442.0 |
| 2 | 530.1 | 420.0 | 423.0 | 438.0 | 435.0 |
| 3 | 730.1 | 416.0 | 410.0 | 431.0 | 428.0 |
| 4 | 1430.1 | 412.0 | 425.0 | 424.0 | 421.0 |
data1の510.1のところをみると、ここは元はNaNでしたが、449と420の平均値434.5になってます。今回の場合は0, 510.1, 530.1の間隔を考慮して補間する必要があります。
gnuplot最強ってことがわかっただけなきもしなくもない。。。