46
45

Delete article

Deleted articles cannot be recovered.

Draft of this article would be also deleted.

Are you sure you want to delete this article?

More than 5 years have passed since last update.

matplotlib ログスケール表示とグリッド表示

Posted at

使おうと思ったときに忘れるのでメモ。matplotlibでのログ(対数)スケール表示とグリッド(目盛線)の表示方法。

環境

  • Python 3.5.1
  • matplotlib 1.5.1

準備

まずはmatplotlibをインポートします

import matplotlib.pyplot as plt

ログスケール表示

y軸をログスケールにするためにはyscaleを'log'に指定します。x軸をログスケールにしたい場合はplt.xscale('log')です。

plt.plot([10,20,30],[10,100,1000],marker='^')
plt.yscale('log')
plt.show()

figure_1.png

グリッド表示

グリッドを表示するにはplt.grid()を指定します。which=の'major'と'minor'はそれぞれ主目盛線と補助目盛線です。colorlinestyleで色や線種も指定できます。

plt.plot([10,20,30],[10,100,1000],marker='^')
plt.yscale('log')

plt.grid(which='major',color='black',linestyle='-')
plt.grid(which='minor',color='black',linestyle='-')

plt.show()
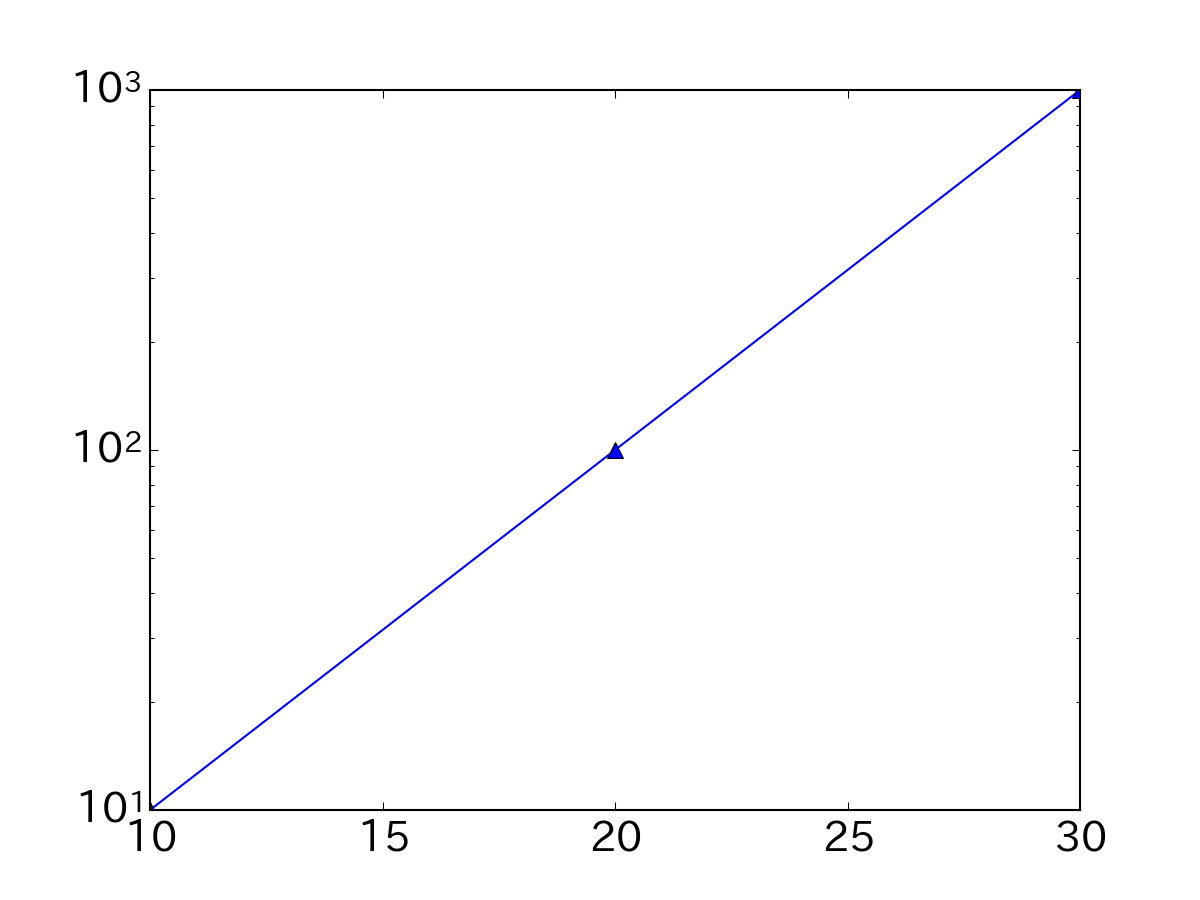
figure_.png

46
45
0

Register as a new user and use Qiita more conveniently

  1. You get articles that match your needs
  2. You can efficiently read back useful information
  3. You can use dark theme
What you can do with signing up
46
45

Delete article

Deleted articles cannot be recovered.

Draft of this article would be also deleted.

Are you sure you want to delete this article?