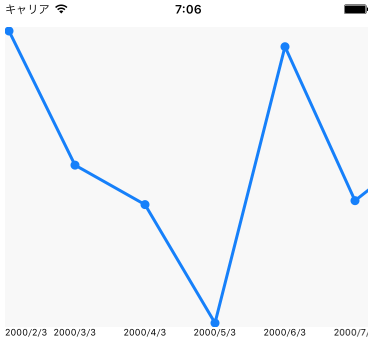
ライブラリを使わずに自作でかんたんなグラフを書いてみた。スクロールビューに対応して、グラフの横幅が無限に増えていってもスクロールでグリグリみることができます。
:ViewController.swift

import UIKit

class ViewController: UIViewController {

    @IBOutlet weak var scview: UIScrollView! //storyboardでスクロールビューを配置しているので接続

    override func viewDidLoad() {
        super.viewDidLoad()

        let graphview = Graph() //グラフを表示するクラス
        scview.addSubview(graphview) //グラフをスクロールビューに配置
        graphview.drawLineGraph() //グラフ描画開始

        scview.contentSize = CGSize(width:graphview.checkWidth()+20, height:graphview.checkHeight()) //スクロールビュー内のコンテンツサイズ設定
    }

}
グラフを表示するクラスは以下。
:Graph.swift
import UIKit

class Graph: UIView {

    var lineWidth:CGFloat = 3.0 //グラフ線の太さ
    var lineColor:UIColor = UIColor(red:0.088,  green:0.501,  blue:0.979, alpha:1) //グラフ線の色
    var circleWidth:CGFloat = 4.0 //円の半径
    var circleColor:UIColor = UIColor(red:0.088,  green:0.501,  blue:0.979, alpha:1) //円の色

    var memoriMargin: CGFloat = 70 //横目盛の感覚
    var graphHeight: CGFloat = 300 //グラフの高さ
    var graphPoints: [String] = []
    var graphDatas: [CGFloat] = []

    func drawLineGraph()
    {
        graphPoints = ["2000/2/3", "2000/3/3", "2000/4/3", "2000/5/3", "2000/6/3", "2000/7/3", "2000/8/3"]
        graphDatas = [100, 30, 10, -50, 90, 12, 40]

        GraphFrame()
        MemoriGraphDraw()
    }

    //グラフを描画するviewの大きさ
    func GraphFrame(){
        self.backgroundColor = UIColor(red:0.972,  green:0.973,  blue:0.972, alpha:1)
        self.frame = CGRectMake(10 , 0, checkWidth(), checkHeight())
    }

    //横目盛・グラフを描画する
    func MemoriGraphDraw() {

        var count:CGFloat = 0
        for memori in graphPoints {

            let label = UILabel()
            label.text = String(memori)
            label.font = UIFont.systemFontOfSize(9)

            //ラベルのサイズを取得
            let frame = CGSizeMake(250, CGFloat.max)
            let rect = label.sizeThatFits(frame)

            //ラベルの位置
            var lebelX = (count * memoriMargin)-rect.width/2

            //最初のラベル
            if Int(count) == 0{
                lebelX = (count * memoriMargin)
            }

            //最後のラベル
            if Int(count+1) == graphPoints.count{
                lebelX = (count * memoriMargin)-rect.width
            }

            label.frame = CGRectMake(lebelX , graphHeight, rect.width, rect.height)
            self.addSubview(label)

            count += 1
        }
    }

    //グラフの線を描画
    override func drawRect(rect: CGRect) {

        var count:CGFloat = 0
        let linePath = UIBezierPath()
        var myCircle = UIBezierPath()

        linePath.lineWidth = lineWidth
        lineColor.setStroke()

        for datapoint in graphDatas {

            if Int(count+1) < graphDatas.count {

                var nowY: CGFloat = datapoint/yAxisMax * (graphHeight - circleWidth)
                nowY = graphHeight - nowY

                if(graphDatas.minElement()!<0){
                    nowY = (datapoint - graphDatas.minElement()!)/yAxisMax * (graphHeight - circleWidth)
                    nowY = graphHeight - nowY
                }

                //次のポイントを計算
                var nextY: CGFloat = 0
                nextY = graphDatas[Int(count+1)]/yAxisMax * (graphHeight - circleWidth)
                nextY = graphHeight - nextY

                if(graphDatas.minElement()!<0){
                    nextY = (graphDatas[Int(count+1)] - graphDatas.minElement()!)/yAxisMax * (graphHeight - circleWidth)
                    nextY = graphHeight - nextY - circleWidth
                }

                //最初の開始地点を指定
                var circlePoint:CGPoint = CGPoint()
                if Int(count) == 0 {
                    linePath.moveToPoint(CGPoint(x: count * memoriMargin + circleWidth, y: nowY))
                    circlePoint = CGPoint(x: count * memoriMargin + circleWidth, y: nowY)
                    myCircle = UIBezierPath(arcCenter: circlePoint,radius: circleWidth,startAngle: 0.0,endAngle: CGFloat(M_PI*2),clockwise: false)
                    circleColor.setFill()
                    myCircle.fill()
                    myCircle.stroke()
                }

                //描画ポイントを指定
                linePath.addLineToPoint(CGPoint(x: (count+1) * memoriMargin, y: nextY))

                //円をつくる
                circlePoint = CGPoint(x: (count+1) * memoriMargin, y: nextY)
                myCircle = UIBezierPath(arcCenter: circlePoint,
                    // 半径
                    radius: circleWidth,
                    // 初角度
                    startAngle: 0.0,
                    // 最終角度
                    endAngle: CGFloat(M_PI*2),
                    // 反時計回り
                    clockwise: false)
                circleColor.setFill()
                myCircle.fill()
                myCircle.stroke()

            }

            count += 1

        }

        linePath.stroke()


    }

    // 保持しているDataの中で最大値と最低値の差を求める
    var yAxisMax: CGFloat {
        return graphDatas.maxElement()!-graphDatas.minElement()!
    }

    //グラフ横幅を算出
    func checkWidth() -> CGFloat{
        return CGFloat(graphPoints.count-1) * memoriMargin + (circleWidth * 2)
    }

    //グラフ縦幅を算出
    func checkHeight() -> CGFloat{
        return graphHeight
    }


}