PrometheusをKubernetes上に構築する際、Kubernetes Operatorを使うのがメジャーだと思うが、これはcert-manager向けの作り込みもされており、cert-managerが導入済みであれば簡単にTLS化して立てることもできる。
今回はそれを試してみる。
なお、前提として既にKubernetes環境があり、type: LoadBalancerが使えるものとする。
ベースとなるKubernetesにはvSphere with Tanzu(Kubernetes:v1.25.7)を利用したが、おそらく何を使っても同じ結果が得られるはず。
事前準備:IngressControllerとcert-managerの導入
PrometheusとGrafanaをクラスタ外に公開するのにIngressを使い、証明書の管理にcert-managerを使う。
Prometheus OperatorのHelm的にはIngress Controllerはnginx-ingressを想定した作りになっているが、商用環境でnginx-ingressを使う人は少ないと思うので、ここではContourで進める。
Contourのインストール
今回はディストリビューション依存をなくすため、Tanzu Packagesは使わずに普通にOSS版のContourをインストールする。
helm repo add bitnami https://charts.bitnami.com/bitnami
helm install contour bitnami/contour --namespace projectcontour --create-namespace
Podが立ち上がってEnvoyのServiceにExternal-IPが割り振られればOK。
$ kubectl get all -n projectcontour
NAME                                   READY   STATUS    RESTARTS   AGE
pod/contour-contour-64c7959cf9-vk684   1/1     Running   0          91s
pod/contour-envoy-b72ld                2/2     Running   0          91s
pod/contour-envoy-bkxvp                2/2     Running   0          91s
pod/contour-envoy-plspq                2/2     Running   0          91s

NAME                    TYPE           CLUSTER-IP       EXTERNAL-IP      PORT(S)                      AGE
service/contour         ClusterIP      10.102.173.86    <none>           8001/TCP                     91s
service/contour-envoy   LoadBalancer   10.100.171.238   10.214.154.165   80:32533/TCP,443:31826/TCP   91s

NAME                           DESIRED   CURRENT   READY   UP-TO-DATE   AVAILABLE   NODE SELECTOR   AGE
daemonset.apps/contour-envoy   3         3         3       3            3           <none>          91s

NAME                              READY   UP-TO-DATE   AVAILABLE   AGE
deployment.apps/contour-contour   1/1     1            1           91s

NAME                                         DESIRED   CURRENT   READY   AGE
replicaset.apps/contour-contour-64c7959cf9   1         1         1       92s
また、IngressClassも作成される。
$ kubectl get ingressclass
NAME      CONTROLLER                                         PARAMETERS   AGE
contour   projectcontour.io/projectcontour/contour-contour   <none>       12m
cert-managerのインストール
cert-managerもHelmでインストールする。
helm repo add jetstack https://charts.jetstack.io --force-update
helm repo update
helm install cert-manager jetstack/cert-manager --namespace cert-manager  --create-namespace --set installCRDs=true
Podが起動してCRDもインストールされていればOK。
$ kubectl get all -n cert-manager
NAME                                           READY   STATUS    RESTARTS   AGE
pod/cert-manager-578c949894-4t8sg              1/1     Running   0          82s
pod/cert-manager-cainjector-6d94d78587-x9xfv   1/1     Running   0          82s
pod/cert-manager-webhook-7b6dfb95d5-mjgct      1/1     Running   0          82s

NAME                           TYPE        CLUSTER-IP      EXTERNAL-IP   PORT(S)    AGE
service/cert-manager           ClusterIP   10.96.235.229   <none>        9402/TCP   82s
service/cert-manager-webhook   ClusterIP   10.97.130.86    <none>        443/TCP    82s

NAME                                      READY   UP-TO-DATE   AVAILABLE   AGE
deployment.apps/cert-manager              1/1     1            1           83s
deployment.apps/cert-manager-cainjector   1/1     1            1           83s
deployment.apps/cert-manager-webhook      1/1     1            1           83s

NAME                                                 DESIRED   CURRENT   READY   AGE
replicaset.apps/cert-manager-578c949894              1         1         1       83s
replicaset.apps/cert-manager-cainjector-6d94d78587   1         1         1       83s
replicaset.apps/cert-manager-webhook-7b6dfb95d5      1         1         1       83s
$ kubectl api-resources |grep cert-manager
challenges                                                             acme.cert-manager.io/v1                  true         Challenge
orders                                                                 acme.cert-manager.io/v1                  true         Order
certificaterequests               cr,crs                               cert-manager.io/v1                       true         CertificateRequest
certificates                      cert,certs                           cert-manager.io/v1                       true         Certificate
clusterissuers                                                         cert-manager.io/v1                       false        ClusterIssuer
issuers                                                                cert-manager.io/v1                       true         Issuer
Promethes Operatorのインストール
kube-prometheus-stackを使ってデプロイする。
まず最初にHelmのリポジトリを追加する。
helm repo add prometheus-community https://prometheus-community.github.io/helm-charts
helm repo update
Helmのvalues.yamlを取り出す。
helm show values prometheus-community/kube-prometheus-stack > prom-values.yaml
AlertManager、Prometheus、Grafanaについてvalues.yamlに以下の変更を加える。
- Ingressの有効化
- IngressClassの指定
- ホスト名の設定
- cert-manager使用の有効化
- IngressのAnnotationにcert-managerの自己署名証明書の
Issuerを指定し証明書を発行する
自己署名証明書用のIssuerについてはPrometheus OperatorのHelm内で<Helmのリリース名>-kube-prom-self-signed-issuerが作成されるので、これを使って自己署名証明書を発行する。
また、ホスト名にはここではフリーのワイルドカードDNSサービスのnip.ioを使い、prometheus.10-214-154-165.nip.ioのような感じでContourのEnvoyのExternal-IPを渡すようにしている。
自前のドメインを使う場合はドメインの指す先をEnvoyのExternal-IPにし、そのドメインをvalues.yamlに記載するとよい。
最終的な変更は以下のようになった。
差分(クリックして表示)
@@ -385,13 +385,14 @@
   #       {{ end }}

   ingress:
-    enabled: false
+    enabled: true

     # For Kubernetes >= 1.18 you should specify the ingress-controller via the field ingressClassName
     # See https://kubernetes.io/blog/2020/04/02/improvements-to-the-ingress-api-in-kubernetes-1.18/#specifying-the-class-of-an-ingress
-    # ingressClassName: nginx
+    ingressClassName: contour

-    annotations: {}
+    annotations:
+      cert-manager.io/issuer: prometheus-stack-kube-prom-self-signed-issuer

     labels: {}

@@ -403,8 +404,8 @@

     ## Hosts must be provided if Ingress is enabled.
     ##
-    hosts: []
-      # - alertmanager.domain.com
+    hosts:
+    - alertmanager.10-214-154-165.nip.io

     ## Paths to use for ingress rules - one path should match the alertmanagerSpec.routePrefix
     ##
@@ -418,10 +419,10 @@
     ## TLS configuration for Alertmanager Ingress
     ## Secret must be manually created in the namespace
     ##
-    tls: []
-    # - secretName: alertmanager-general-tls
-    #   hosts:
-    #   - alertmanager.example.com
+    tls:
+    - secretName: alertmanager-general-tls
+      hosts:
+      - alertmanager.10-214-154-165.nip.io

   ## Configuration for Alertmanager secret
   ##
@@ -977,16 +978,17 @@
   ingress:
     ## If true, Grafana Ingress will be created
     ##
-    enabled: false
+    enabled: true

     ## IngressClassName for Grafana Ingress.
     ## Should be provided if Ingress is enable.
     ##
-    # ingressClassName: nginx
+    ingressClassName: contour

     ## Annotations for Grafana Ingress
     ##
-    annotations: {}
+    annotations:
+      cert-manager.io/issuer: prometheus-stack-kube-prom-self-signed-issuer
       # kubernetes.io/ingress.class: nginx
       # kubernetes.io/tls-acme: "true"

@@ -999,7 +1001,8 @@
     ##
     # hosts:
     #   - grafana.domain.com
-    hosts: []
+    hosts:
+    - grafana.10-214-154-165.nip.io

     ## Path for grafana ingress
     path: /
@@ -1007,10 +1010,10 @@
     ## TLS configuration for grafana Ingress
     ## Secret must be manually created in the namespace
     ##
-    tls: []
-    # - secretName: grafana-general-tls
-    #   hosts:
-    #   - grafana.example.com
+    tls:
+    - secretName: grafana-general-tls
+      hosts:
+      - grafana.10-214-154-165.nip.io

   # # To make Grafana persistent (Using Statefulset)
   # #
@@ -2457,7 +2460,7 @@

     # Use certmanager to generate webhook certs
     certManager:
-      enabled: false
+      enabled: true
       # self-signed root certificate
       rootCert:
         duration: ""  # default to be 5y
@@ -3136,13 +3139,14 @@
   #     someoneelse:$apr1$DMZX2Z4q$6SbQIfyuLQd.xmo/P0m2c.

   ingress:
-    enabled: false
+    enabled: true

     # For Kubernetes >= 1.18 you should specify the ingress-controller via the field ingressClassName
     # See https://kubernetes.io/blog/2020/04/02/improvements-to-the-ingress-api-in-kubernetes-1.18/#specifying-the-class-of-an-ingress
-    # ingressClassName: nginx
+    ingressClassName: contour

-    annotations: {}
+    annotations:
+      cert-manager.io/issuer: prometheus-stack-kube-prom-self-signed-issuer
     labels: {}

     ## Redirect ingress to an additional defined port on the service
@@ -3153,7 +3157,8 @@
     ##
     # hosts:
     #   - prometheus.domain.com
-    hosts: []
+    hosts:
+    - prometheus.10-214-154-165.nip.io

     ## Paths to use for ingress rules - one path should match the prometheusSpec.routePrefix
     ##
@@ -3167,10 +3172,10 @@
     ## TLS configuration for Prometheus Ingress
     ## Secret must be manually created in the namespace
     ##
-    tls: []
-      # - secretName: prometheus-general-tls
-      #   hosts:
-      #     - prometheus.example.com
+    tls:
+    - secretName: prometheus-general-tls
+      hosts:
+      - prometheus.10-214-154-165.nip.io

   ## Configuration for creating an Ingress that will map to each Prometheus replica service
   ## prometheus.servicePerReplica must be enabled
変更したvalues.yamlを用いてPrometheus/Grafanaをデプロイする。
helm upgrade -i -f prom-values.yaml prometheus-stack prometheus-community/kube-prometheus-stack -n prometheus-stack --create-namespace
デプロイが成功すると、以下のような感じでIngressが作成される。
$ kubectl get ing -n prometheus-stack
NAME                                      CLASS     HOSTS                                ADDRESS          PORTS     AGE
prometheus-stack-grafana                  contour   grafana.10-214-154-165.nip.io        10.214.154.165   80, 443   106s
prometheus-stack-kube-prom-alertmanager   contour   alertmanager.10-214-154-165.nip.io   10.214.154.165   80, 443   106s
prometheus-stack-kube-prom-prometheus     contour   prometheus.10-214-154-165.nip.io     10.214.154.165   80, 443   106s
自己署名証明書の発行のためのIssuerも作成され、それを元にCertificateも作成される。
TLSでのアクセスが上手く行かない場合はCertificateが上手く作れているか(READYがTrueになっているか)を確認するとよい。
$ kubectl get issuer,certificate -n prometheus-stack
NAME                                                                   READY   AGE
issuer.cert-manager.io/prometheus-stack-kube-prom-root-issuer          True    50s
issuer.cert-manager.io/prometheus-stack-kube-prom-self-signed-issuer   True    50s

NAME                                                               READY   SECRET                                 AGE
certificate.cert-manager.io/alertmanager-general-tls               True    alertmanager-general-tls               50s
certificate.cert-manager.io/grafana-general-tls                    True    grafana-general-tls                    50s
certificate.cert-manager.io/prometheus-general-tls                 True    prometheus-general-tls                 50s
certificate.cert-manager.io/prometheus-stack-kube-prom-admission   True    prometheus-stack-kube-prom-admission   50s
certificate.cert-manager.io/prometheus-stack-kube-prom-root-cert   True    prometheus-stack-kube-prom-root-cert   50s
作成された証明書は以下となる。
$ kubectl get secret -n prometheus-stack |grep general
alertmanager-general-tls                                            kubernetes.io/tls    3      53m
grafana-general-tls                                                 kubernetes.io/tls    3      53m
prometheus-general-tls                                              kubernetes.io/tls    3      53m
適切にSANが設定されているか試しに1つ見てみる。
kubectl get secret -n prometheus-stack prometheus-general-tls -o jsonpath={.data.'ca\.crt'} | base64 -d | openssl x509 -noout -text | grep -A 1 "Subject Alternative Name"
得られた出力は以下となる。
            X509v3 Subject Alternative Name: critical
                DNS:prometheus.10-214-154-165.nip.io
問題なさそうだ。
動作確認
実際にPrometheusにブラウザでアクセスしてみる。
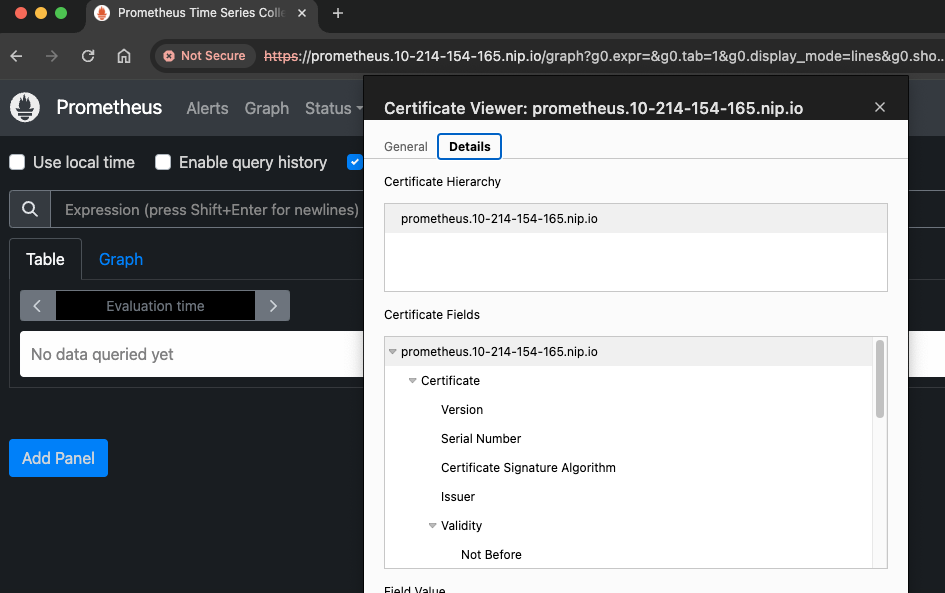
アクセス自体は問題ない。ただ、targetsを確認したところNode Exporterなどいくつかのターゲットからメトリクスが取れていなかった。
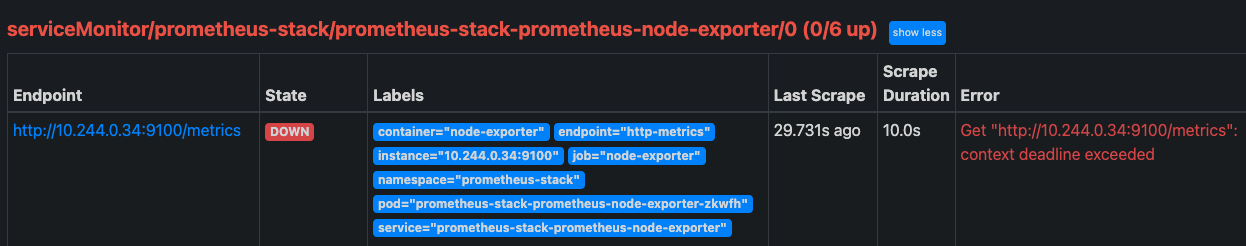
おそらくvSphere with TanzuのPSAが原因と思われるので、一旦ここでは放置する。
次にGrafanaにもアクセスしてみる。
初期アカウントはadmin/prom-operatorでログイン出来るので、こちらでログインする。
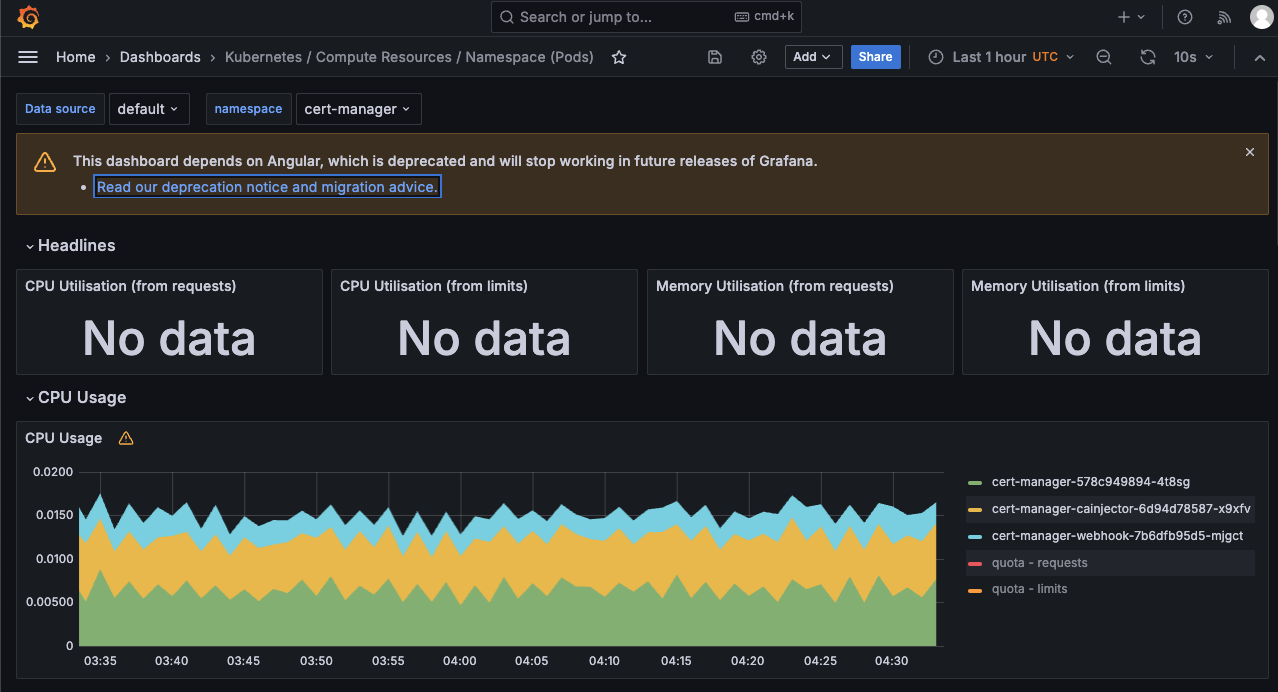
こちらも問題なくアクセスでき、ダッシュボードも利用することが出来た。
一部のメトリクスが取れておらずNo dataになっているのは、上述のPSAが原因だと思われるのでPrometheus Operator自体はおそらく問題ないと思われる。