概要
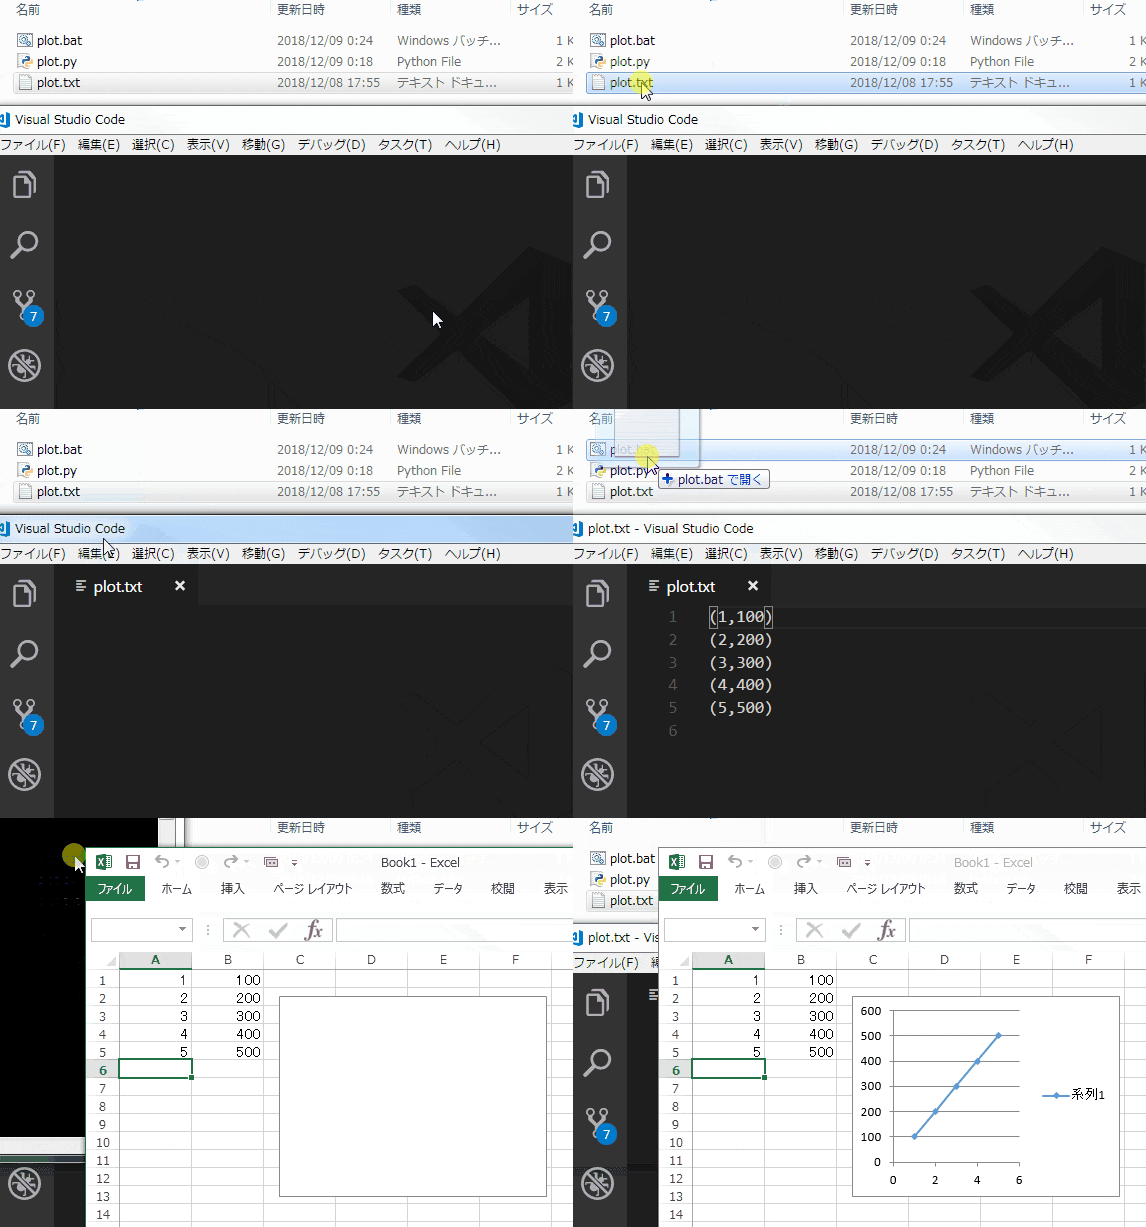
VBScriptで書いた正規表現にマッチした部分をExcelに書き出す + プロットするのpython版です。

使ったデータ
plot.txt
(1,100)
(2,200)
(3,300)
(4,400)
(5,500)
使った正規表現
"\((\d),(\d{3})\)"
バッチファイル(plot.bat)
使いたいpython.exeを下記の引数で呼び出しているだけです
plot.bat
@echo off
使いたいpython.exeのフォルダ\python plot.py %1
コード
excel.Visible = Falseにする場合は、スクリプトの最後でSave/SaveAs→Close→Quitの流れで閉じるようにします。Quitを呼ばないとExcel.exeが残ります。
plot.py
# -*- coding: utf-8 -*-
import sys
import chardet
import win32com.client
import re

def plot(fname):
    #------ 本題とあまり関係ない部分 ここから ------
    #Excelを起動する
    excel = win32com.client.DispatchEx("Excel.Application")

    #Excelを画面表示する : VisibleプロパティをTrueにする
    excel.Visible = True #FalseにするときはSave/SaveAs→Close→Quitの流れが必要(Excel.exeが残ってしまう)

    #Excelを最前面に表示する
    WshShell = win32com.client.Dispatch("WScript.Shell")
    WshShell.AppActivate(excel.Caption)

    #アクティブなシートのオブジェクトを持っておく
    sheet = excel.Workbooks.Add().ActiveSheet

    #入力のテキストファイルのencoding判定しておく
    encoding = ""
    with open(fname, "rb") as f:
        encoding=chardet.detect(f.read())["encoding"]
    #------ 本題とあまり関係ない部分 ここまで ------

    ##
    # 正規表現にマッチした部分をExcelに書き出す + プロットする
    ##
    # まずは、正規表現にマッチした部分をExcelに書き出す
    with open(fname, encoding=encoding) as f:
        for s in f:
            m = re.search(r"\((\d),(\d{3})\)", s) #パターン設定+検索実行
            if m:
                #マッチした場合
                #Excelに書き出す
                sheet.Cells(excel.ActiveCell.Row,1).Value = m.group(1)
                sheet.Cells(excel.ActiveCell.Row,2).Value = m.group(2)

                #セルを次の行に進めておく
                sheet.Cells(excel.ActiveCell.Row+1,1).Select()

    # 次に、Excelに書き出したデータをプロットする

    chart = sheet.ChartObjects().Add(120, 20, 200, 150) #チャートオブジェクトを作る

    chart.Chart.ChartType = 74 #散布図にする。xlXYScatterLines(74)

    chart.Chart.SetSourceData(sheet.UsedRange) #データソースに書き出した箇所を設定する

if __name__ == "__main__":
    plot(fname=sys.argv[1])