1
1

Delete article

Deleted articles cannot be recovered.

Draft of this article would be also deleted.

Are you sure you want to delete this article?

More than 3 years have passed since last update.

【ggplot2/R】stat_function()関数で回帰直線を書く

Last updated at Posted at 2019-08-22

備忘録的なメモです。

初めに、回帰モデルを作成します。

y = b_0 + b_1x \\

C1:説明変数
C2:目的変数
DF:データフレーム

Model1 <- lm(C2 ~ C1, DF)

次に回帰係数のパラメーターの値を取り出し、表示する。

a <- Model1$coefficients #回帰係数の値を取り出す
a
a[1] #1つずつ表示(b0)
a[2] #1つずつ表示(b1)

関数ggplot()とstat_function()を組み合わせると、このパラメーターの値を使って回帰直線を引くことができます。

ggplot(DF, aes(x = C1, y = C2)) +
  geom_point(color = "orange", size = 3) +
  stat_function(color = "red",
                fun = function(x) a[1] + a[2]*x) 
# stat_function()で関数を描画
# fun = function(x)の後にxの関数を記述する
# xは最初にggplot()で指定したx軸と対応づけられる

fun = function(x)の後にxの関数を記述します。
xは最初にggplot()で指定したx軸と対応づけられます。
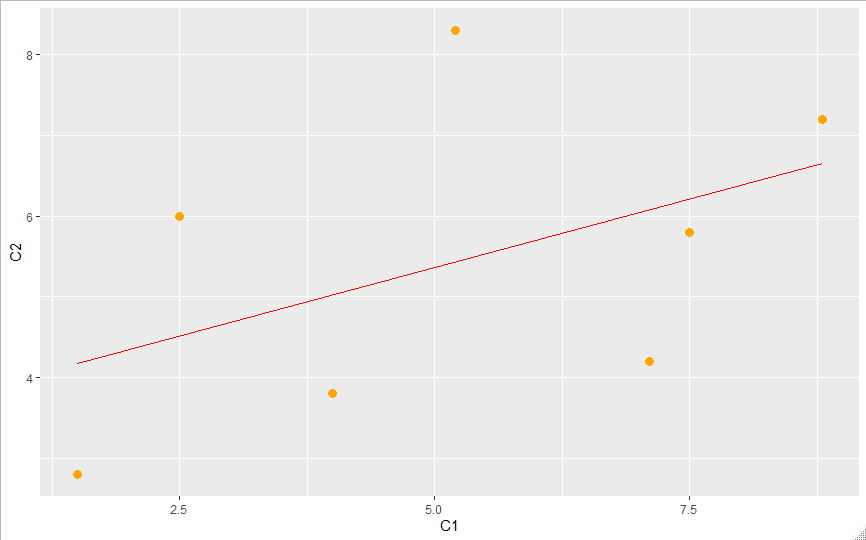
こんな感じの図に。
image.png

1
1
0

Register as a new user and use Qiita more conveniently

  1. You get articles that match your needs
  2. You can efficiently read back useful information
  3. You can use dark theme
What you can do with signing up
1
1

Delete article

Deleted articles cannot be recovered.

Draft of this article would be also deleted.

Are you sure you want to delete this article?