Rを使ってELISAの測定値から4係数ロジスティック曲線を描く方法を紹介します。
関数**ggplot()とstat_function()**を組み合わせて書きます。
ELISAのデータ
今回使用するデータ(ELISA.csv)です。
| Concentration | Absorbance |
|:-----------|------------:|:------------:|
|10|3.0802|
|3.333333333|3.0151|
|1|2.5858|
|0.333333333|1.5019|
|0.1|0.5901|
|0.033333333|0.207|
|0.01|0.0621|
|0|0.0039|
必要なパッケージ
Rを使って4係数ロジスティック回帰分析をするため、drcパッケージをインストールし、読み込みます。
それと、dplyrとggplot2を一括で読み込むためtidyverseも読み込んでおきます。
library(tidyverse)
library(drc)
データの読み込みと確認
**read.csv()**でELISAのCSVデータを読み込み、**glimpse()**で内容を確認しておきます。
ELISA <- read.csv("ELISA.csv")
glimpse(ELISA)
散布図を描く
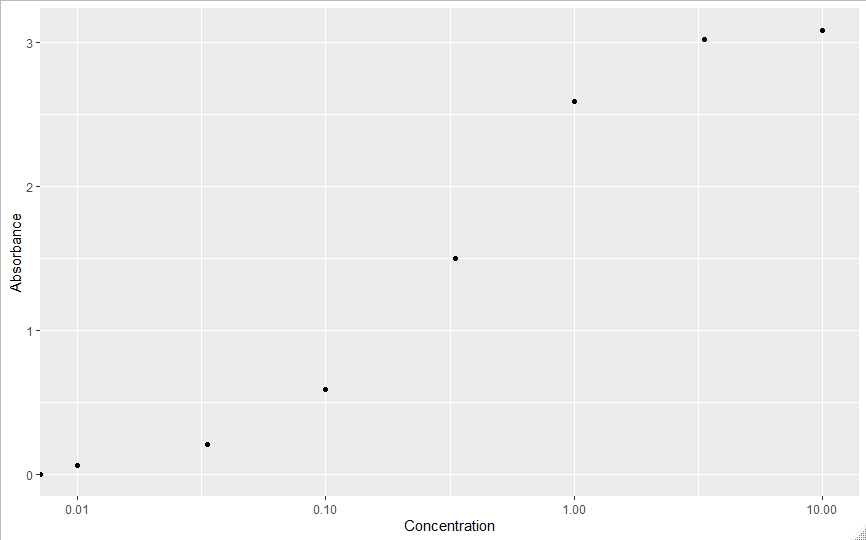
ggplot2でとりあえず散布図を描いてみます。
ggplot(ELISA, aes(x = Concentration, y = Absorbance)) +
  geom_point() +
  scale_x_log10()
4係数ロジスティック回帰分析モデルを作る
drcパッケージの**drm()**を使って4係数ロジスティック回帰分析モデルを作ります。
y = d+\frac{c-d}{1+(\frac{e}{x})^b} \\\
関数drm()のfctで**LL.4()**を指定し、回帰モデルL4pを作ります。
4つのパラメーター(b, c, d, e)は作ったモデルの中のcoefficientsのリストに入っています。
なので、4つのパラメーターを回帰モデルL4pのcoefficientsから取り出します。
L4p <- drm(Absorbance ~ Concentration, data = ELISA, fct = LL.4())
a <- L4p$coefficients #回帰モデルから係数を取り出す
a #回帰係数を表示
a[1]
a[2]
a[3]
a[4]
実行結果はこうなります。
> L4p <- drm(Absorbance ~ Concentration, data = ELISA, fct = LL.4())
> a <- L4p$coefficients #回帰モデルから係数を取り出す
> a #回帰係数を表示
b:(Intercept) c:(Intercept) d:(Intercept) e:(Intercept)
-1.2631086189  0.0008242024  3.1637420197  0.3374669485
> a[1]
b:(Intercept)
    -1.263109
> a[2]
c:(Intercept)
 0.0008242024
> a[3]
d:(Intercept)
     3.163742
> a[4]
e:(Intercept)
    0.3374669
最後にstat_function()で4係数ロジスティック回帰を描く
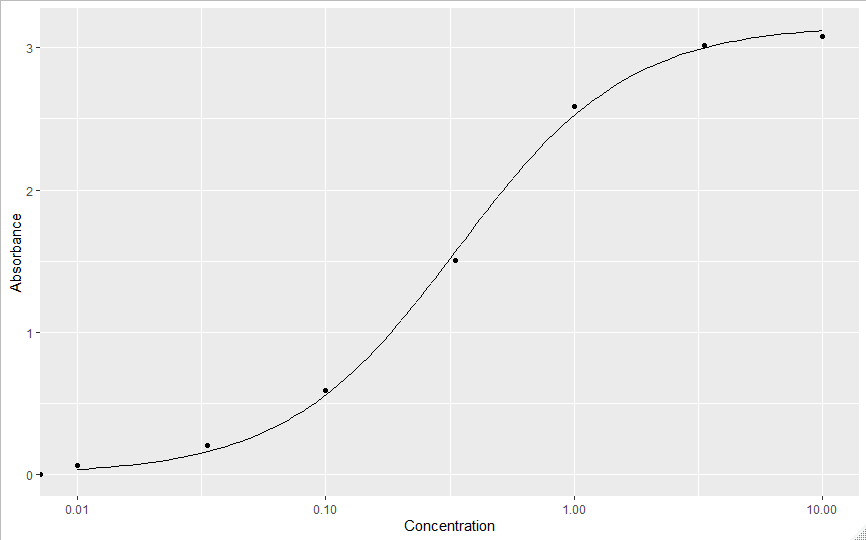
最初に作った散布図に、分析モデルで推定した4つの回帰係数と関数**stat_function()**を使って回帰曲線を加えます。
fun = function(x)の後にxの関数を描きます。
ggplot(ELISA, aes(x = Concentration, y = Absorbance)) +
  geom_point() +
  stat_function(fun = function(x) a[3] + (a[2] - a[3]) / (1 + (a[4] / x)^a[1])) +
  scale_x_log10()
こんな感じで4係数ロジスティック回帰曲線が描けました。
最終的なスクリプト
# ELISAの測定値で4係数ロジスティック回帰分析

# Rをキレイにしておく
rm(list = ls())

# ライブラリの読み込み
library(tidyverse)
library(drc)

# データの読み込みと内容の確認
ELISA <- read.csv("ELISA.csv")
glimpse(ELISA)

# データを調べるための最初のプロット
ggplot(ELISA, aes(x = Concentration, y = Absorbance)) +
  geom_point() +
  scale_x_log10()

# drm()を使って4係数ロジスティック回帰分析モデルを作る
L4p <- drm(Absorbance ~ Concentration, data = ELISA, fct = LL.4())
a <- L4p$coefficients #回帰モデルから係数を取り出す
a #回帰係数を表示
a[1]
a[2]
a[3]
a[4]

# stat_function()で4係数ロジスティック回帰を描く
ggplot(ELISA, aes(x = Concentration, y = Absorbance)) +
  geom_point() +
  stat_function(fun = function(x) a[3] + (a[2] - a[3]) / (1 + (a[4] / x)^a[1])) +
  scale_x_log10()

