はじめに
似たような2つの信号について、それらの遅延時間を相互相関関数を計算することによって推定します。
相互相関関数の計算には、PythonのNumpyを用います。
信号の作成
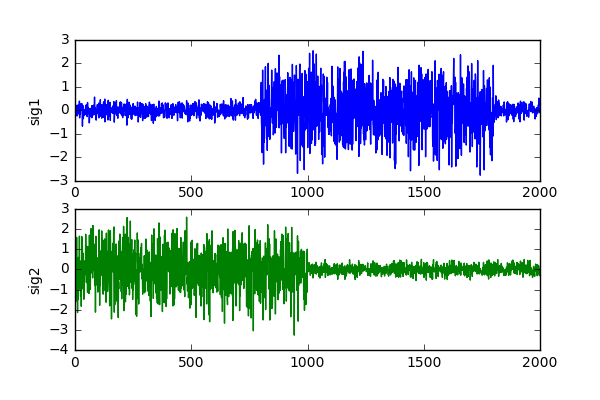
例として、正規分布の目的信号に正規分布のノイズに重ねた信号を、遅延の有るものと無いものの2つ作成します。
import numpy as np

target_sig = np.random.normal(size=1000) * 1.0
delay = 800
sig1 = np.random.normal(size=2000) * 0.2
sig1[delay:delay+1000] += target_sig
sig2 = np.random.normal(size=2000) * 0.2
sig2[:1000] += target_sig
相互相関関数の計算
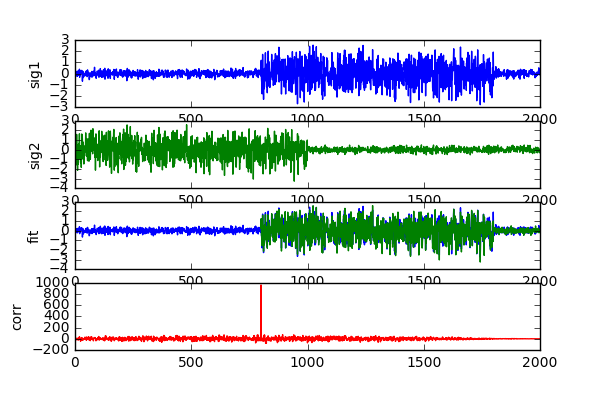
作成した2つの信号の相互相関関数をnp.correlate()で計算します。相互相関関数の最大となる位置が、遅延時間となります。
ひとつ注意点として、信号の平均値が0から離れている場合、相互相関関数の計算に影響を与えるので、
sig1 = sig1 - sig1.mean()といったように平均を0にするといった処理を加える必要があります。
import numpy as np

corr = np.correlate(sig1, sig2, "full")
estimated_delay = corr.argmax() - (len(sig2) - 1)
print("estimated delay is " + str(estimated_delay))
estimated delay is 800
描画
最後に描画します。相互相関関数の値において、遅延時間を示す部分に大きなピークが立っているのが分かります。
import matplotlib.pyplot as plt

plt.subplot(4, 1, 1)
plt.ylabel("sig1")
plt.plot(sig1)

plt.subplot(4, 1, 2)
plt.ylabel("sig2")
plt.plot(sig2, color="g")

plt.subplot(4, 1, 3)
plt.ylabel("fit")
plt.plot(np.arange(len(sig1)), sig1)
plt.plot(np.arange(len(sig2)) + estimated_delay, sig2 )
plt.xlim([0, len(sig1)])

plt.subplot(4, 1, 4)
plt.ylabel("corr")
plt.plot(np.arange(len(corr)) - len(sig2) + 1, corr, color="r")
plt.xlim([0, len(sig1)])

plt.show()