概要
Pythonista でリアルタイムグラフ表示を行おうとして、最初 pyplot を試したところ結構遅かったので ui.WebView 上で Google Charts を使ったグラフ表示と速度比較を行ってみました。
環境
- iPad mini 4 iOS 12.1.1
- Pythonista3 v3.2
実行結果
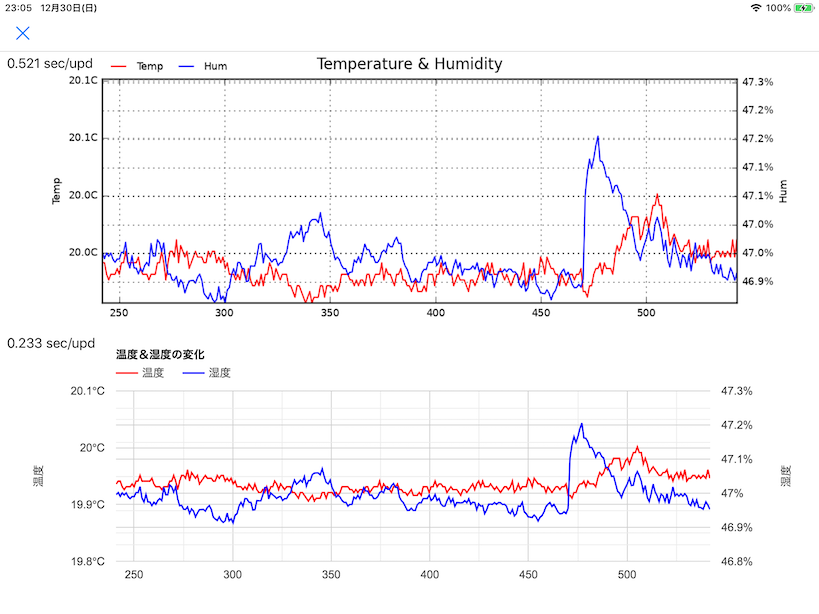
表示対象のデータは Raspberry Pi に接続した BME280 の温度と湿度の値で、1秒間隔で取得して最新の300件(5分間)のグラフ表示の更新にどれだけかかるかを計測しています。
上側の pyplot による表示は更新に 0.521 秒
下側の ui.WebView + Google Charts による表示は更新に 0.233 秒
元々やりたかったのは 0.05 秒間隔で送られてくるデータの表示で、グラフの更新間隔は遅くするとしても、更新中に送られてくるデータを取りこぼしてしまうのが悩みのタネです。
Pythonistaでリアルタイムグラフ表示。もっと更新が速い方式はないかな。
— 稲澤祐一 (@inasawa) 2018年12月30日
「Pythonistaでリアルタイムグラフ表示(pyplot vs ui.WebView+Google Charts)」https://t.co/egYyRcYdD8#Pythonista pic.twitter.com/Fqu91np7wV
Pythonista プログラム
realtime_charts.py
from matplotlib import pyplot as plt
from matplotlib import ticker
import io
import requests
import time
import ui

HTML = '''
<html>
    <head>
        <title>温度・湿度 - Google Charts</title>
        <script type="text/javascript" src="https://www.gstatic.com/charts/loader.js"></script>
        <script type="text/javascript">
            google.charts.load('current', {'packages':['line', 'corechart']});
            google.charts.setOnLoadCallback(setupChart);

            var optionLineTH = {
                    title: '温度&湿度の変化',
                    width:  1024,
                    height: 350,
                    series: {
                        0: {targetAxisIndex: 0,
                            color: 'red'},
                        1: {targetAxisIndex: 1,
                            color: 'blue'}
                    },
                    vAxes: {
                        0: {title: '温度',
                            format: '#.#℃'},
                        1: {title: '湿度',
                            format: '#.#%'}
                    },
                    hAxis: {
                        format: '#.#'
                    },
                    vAxis: {
                        titleTextStyle: {italic: false}
                    //  viewWindow: {
                    //    max: 30
                    //  }
                    }
                };

            var dataLineTH;
            var chartLineTH;

            function setupChart() {
                dataLineTH = new google.visualization.DataTable();
                dataLineTH.addColumn('number', '秒');
                dataLineTH.addColumn('number', '温度');
                dataLineTH.addColumn('number', '湿度');

                //chartLineTH = new google.charts.Line(document.getElementById('line_chart_temp_hum'));
                chartLineTH = new google.visualization.LineChart(document.getElementById('line_chart_temp_hum'));
            }
            function updateChart(sec, temperature, humidity) {
                dataLineTH.addRow([sec, temperature, humidity / 100])
                if (dataLineTH.getNumberOfRows() > 300)
                    dataLineTH.removeRow(0)

                //chartLineTH.draw(dataLineTH, google.charts.Line.convertOptions(optionLineTH));
                chartLineTH.draw(dataLineTH, optionLineTH);
            }
        </script>
    </head>
    <body>
        <div>
            <div id="line_chart_temp_hum"></div>
        </div>
    </body>
</html>
'''

class MyView(ui.View):
    def __init__(self, *args, **kwargs):
        super().__init__(*args, **kwargs)

    def will_close(self):
        global action_loop
        action_loop = False


frame_w = 1024
frame_h =  700
main_view = MyView(frame=(0, 0, frame_w, frame_h))
main_view.background_color = 'white'

plt_view = ui.ImageView(frame=(0, 0, frame_w, int(frame_h / 2)))
plt_info_view = ui.Label(frame=(0, 0, 150, 30))
main_view.add_subview(plt_view)
main_view.add_subview(plt_info_view)

web_view = ui.WebView(frame=(0, int(frame_h / 2), frame_w, int(frame_h / 2)))
web_info_view = ui.Label(frame=(0, int(frame_h / 2), 150, 30))
main_view.add_subview(web_view)
main_view.add_subview(web_info_view)

main_view.present()

plt.rcParams['axes.labelsize'] = 8
plt.rcParams['xtick.labelsize'] = 8
plt.rcParams['ytick.labelsize'] = 8
fig = plt.figure(figsize=(9, 3))
fig.suptitle('Temperature & Humidity')

ax1 = fig.add_subplot(111)
ax1.grid(True)
ax1.set_ylabel('Temp')
ax2 = ax1.twinx()
ax2.grid(True)
ax2.set_ylabel('Hum')

e_time = []
data_t = []
data_h = []
line_t, = ax1.plot(e_time, data_t, label='Temp', color='red')
line_h, = ax2.plot(e_time, data_h, label='Hum', color='blue')
ax1.legend(bbox_to_anchor=(0.11, 1.12), frameon=False)
ax2.legend(bbox_to_anchor=(0.21, 1.12), frameon=False)
ax1.yaxis.set_major_formatter(ticker.FormatStrFormatter('%.1fC'))
ax2.yaxis.set_major_formatter(ticker.FormatStrFormatter('%.1f%%'))

web_view.load_html(HTML)

s = requests.Session()
action_loop = True
start_time = time.time()
while action_loop:
    event_time = time.time()

    # Web Server に対する GET で以下のようなデータが返るようにしてあります。
    # {"timestamp": "Sun Dec 30 23:27:33 2018", "temperature": 20.00649283626699, "pressure": 1018.4915113213154, "humidity": 46.925826193156354}
    r = s.get('Web Server URL')
    e = r.json()

    # pyplot によるグラフ表示
    plot_start = time.time()
    e_time.append(event_time - start_time)
    if len(e_time) > 300:
        e_time.pop(0)
    data_t.append(e['temperature'])
    if len(data_t) > 300:
        data_t.pop(0)
    data_h.append(e['humidity'])
    if len(data_h) > 300:
        data_h.pop(0)
    line_t.set_data(e_time, data_t)
    line_h.set_data(e_time, data_h)
    ax1.set_xlim(e_time[0], e_time[-1]+0.1)
    ax1.set_ylim(min(data_t), max(data_t)+0.1)
    ax2.set_ylim(min(data_h), max(data_h)+0.1)
    with io.BytesIO() as bIO:
        plt.savefig(bIO)
        plt_view.image = ui.Image.from_data(bIO.getvalue())
        del bIO
    plt_info_view.text = ' {:6.3f} sec/upd'.format(time.time() - plot_start)

    # Google Charts によるグラフ表示
    plot_start = time.time()
    web_view.evaluate_javascript(
        'updateChart({},{},{});'.format(
            event_time - start_time,
            e['temperature'],
            e['humidity']))
    web_info_view.text = ' {:6.3f} sec/upd'.format(time.time() - plot_start)

    # 1秒間隔での更新となるように sleep
    time.sleep(max(0, 1 - (time.time() - event_time)))