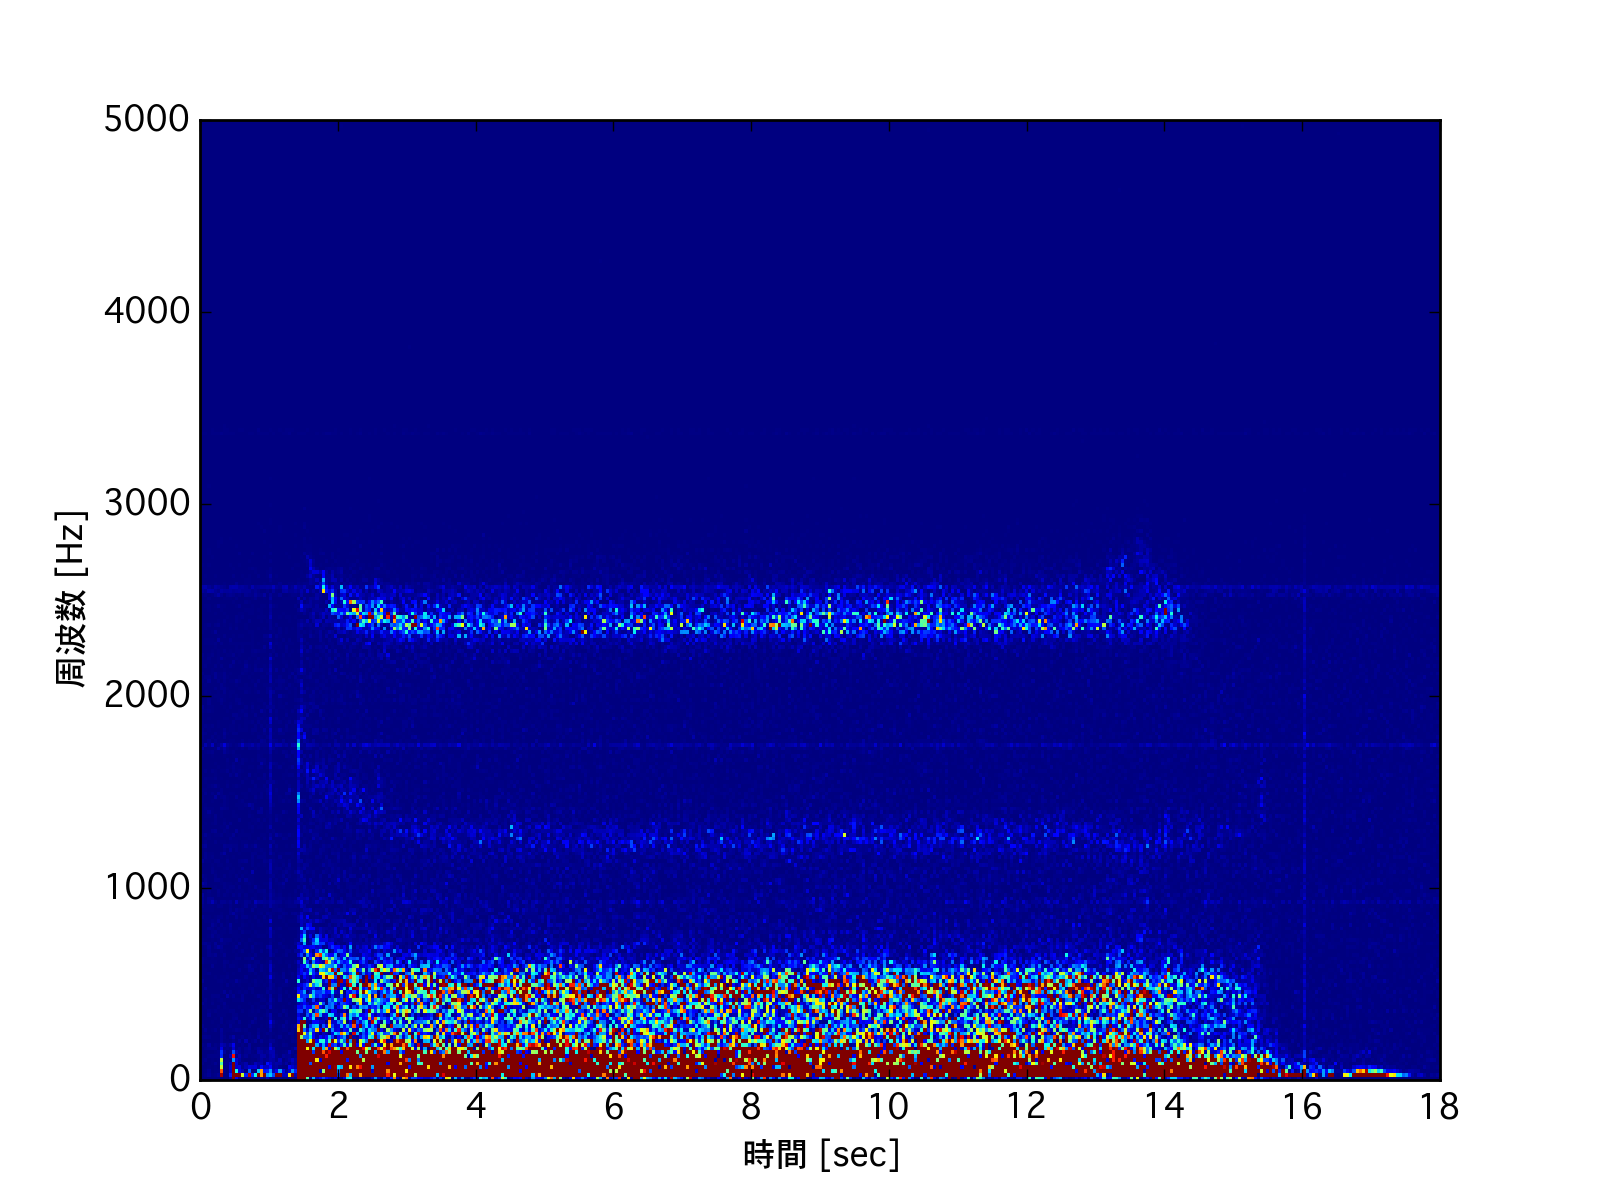
scipy0.16からの機能で、取得した信号にFFTかけたものの時間変化の可視化を容易に書くことが出来るようになってた。任意のデータで声音分析みたいなことが可能。
自分のMac環境ではanacondaでpythonを入れていて、scipyのバージョンが古かったので、
conda update scipy
をして、Scipyを新しいのにした。
時間変化を追うのではない場合はscipyのfftpackを使う。
python使用環境
私はanacondaにて構築、python2.7,scipy0.16,Mac OSX
非定常の周波数解析
scipy.fftpackの関数のFFTでは定常の信号の信号の可視化はできるが、非定常な信号の時間方向の周波数変化を可視化しづらい。scipy.signalのspectrogramを使うとFFTした結果の時間変化が可視化出来る。
例えば、自分の手元データでやってみる。
ここではfft.pyというスクリプトと同じディレクトリにdata.CSVという1列目時間、2列目データを置いたCSVファイルを置いた。
データは10kHzで取得したもの。
コード
# -*- coding: utf-8 -*
import numpy as np
import matplotlib.pyplot as plt
from scipy import fftpack
from scipy import signal

plt.close('all')

input_file = u"data.CSV"
(time, data) = np.loadtxt(input_file,unpack=True, delimiter=",",usecols = (0,1))

fs = 10000.0 # サンプリング周波数
f,t,Sxx = signal.spectrogram(data, fs, nperseg=512)

plt.figure()
plt.pcolormesh(t,f,Sxx,vmax=1e-6)
plt.xlim([0,18])
plt.xlabel(u"時間 [sec]")
plt.ylabel(u"周波数 [Hz]")
# plt.colorbar()
plt.show()
signal.spectrogramのnpersegは周波数の分割数ここを変えると分割数が変わる。デフォルト256。
周波数の立ち方によってはカラーマップが見づらくなるので、matplolibのpcolormeshのvmax/vminの値を指定してやると良い。
参考
