はじめに
PowerPointでスライドを作成していると,サインカーブのような波が欲しくなったりします。
曲線で気合で描いてもよいのですが,端の方がいい塩梅にならないので,VBAで描けるようにしてみました。
(似たようなものは巷にたくさんあると思いますがいい感じに使えるようにしてみたので)
コード
Option Explicit

' Size of the shape, in cm
Private Const Width As Single = 8
Private Const Height As Single = 2.5

' Minimum and maximum value of x-axis.
Private Const xMin As Single = -31.4
Private Const xMax As Single = 31.4
' y range from -1 to +1 will be scaled to the size specified by `Height`

' Number of control points must be 3n+1, where n is a positive integer
Private Const NumPoints As Long = 901

Private Const PixelsPerInch As Single = 72 / 2.54

Function func(ByVal x As Single) As Single

    func = Sin((xMax - 1.28 - xMin) / (xMax - xMin) * (x - xMin)) * Exp(-(x - xMin) / 256)

End Function

Sub DrawFunc()

    If NumPoints Mod 3 <> 1 Then

        MsgBox "Number of control points must be 3n+1, where n is a positive integer", vbExclamation + vbOKOnly
        Exit Sub

    End If

    Dim slide As PowerPoint.slide

    Dim sWidth, sHeight As Single
    Dim xRange As Single
    Dim xScale, yScale As Single
    Dim xOffset, yOffset As Single
    Dim step As Single

    Set slide = ActivePresentation.Slides(1)
    sWidth = ActivePresentation.PageSetup.SlideWidth
    sHeight = ActivePresentation.PageSetup.SlideHeight

    xRange = xMax - xMin
    xScale = Width * PixelsPerInch / xRange
    yScale = Height * PixelsPerInch / -2  ' Invert vertical axis and scale [-1, 1] to 1

    xOffset = sWidth / 2
    yOffset = sHeight / 2

    step = xRange / (NumPoints - 1)

    Dim points(1 To NumPoints, 1 To 2) As Single
    Dim x, y As Single
    Dim i As Long

    For i = 1 To NumPoints

        x = xMin + step * (i - 1)
        y = func(x)
        points(i, 1) = x * xScale + xOffset
        points(i, 2) = y * yScale + yOffset

    Next

    slide.Shapes.AddCurve SafeArrayOfPoints:=points

End Sub
使い方
WidthからNumPointsまでのパラメータを設定し,funcをプロットしたい関数にします。
DrawFuncを実行すると関数のグラフが1ページ目の中央にプロットされます。
※ VBEの起動やマクロの実行方法は他の場所を当たってください。
パラメータ
Width, Height
図形全体の大きさをcm単位で指定します。
高さは,関数の値域が[-1, 1]であるときの大きさが指定した高さになります。
値域が[-2, 2]の場合には実際の高さは2 * Heightになります。1
xMin, xMax
x軸の最小値,最大値を指定します。
NumPoints
描画に用いる制御点の数を指定します。
制御点の数は 3n+1 (nは整数)でなければなりません。
点の数が多いほど曲線は滑らかにはなりますが,その分描画のコストは高くなるのでほどほどにしましょう。
関数
SingleからSingleを返す関数になっていれば分岐などを含んでいても問題ありません。
上述のように値の範囲が2になっていると高さが思った通りのものになります。
実行例
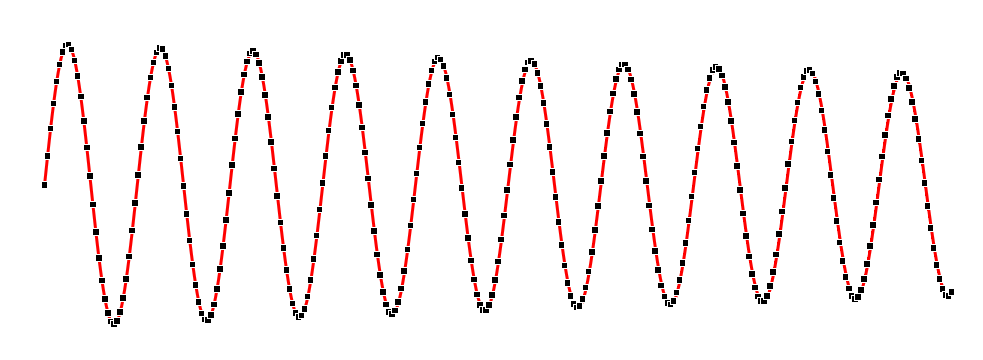
上のコードにある減衰しながら位相がずれるサインカーブは以下のように出ます。
制御点の数で曲線にしているので,頂点の編集をしようとするとツブツブしています。

おわりに
発表用のスライドをわざわざマクロ有効にはしたくないので,プロット用の共通pptmを作成してページを追加しつつ使いまわしています。
色,太さや線のスタイルなども指定できるようにしてもいいかもしれません。
-
元々三角関数をプロットしたかったのでこのような仕様になっています。y軸の範囲も指定してそれによってスケールするようにしても良いかもしれません。 ↩
