座標の回転
基本的な考え方
中心から放射状に線を引いて基本的な回転の仕方を演習します
線の長さ x cos(角度)したものが回転後の横座標です
線の長さ x sin(角度)したものが回転後の縦座標です
算出した座標に中心座標を加算して表示位置を調整します。
放射状に線を引いてみる
import math
import matplotlib
import matplotlib.pyplot as plt
import numpy as np
import PIL.Image
import PIL.ImageDraw
import random

def create_image(w, h):
    im = PIL.Image.new("RGB", (w, h), (0, 0, 0))
    return im
WIDTH = 300
HEIGHT = 200
img = create_image(WIDTH, HEIGHT)
draw = PIL.ImageDraw.Draw(img)

# π を32分割してラジアンの配列で扱う
splitN = 32
radArr = []
for n in range(splitN):
    rad = -math.pi + (n / splitN * math.pi * 2)
    radArr.append(rad)

print(radArr)
# ラジアンの配列を8分割して内容を確認する
for i in range(0, len(radArr), int(len(radArr) / 8)):
    print("radArr[{}]={}".format(i, radArr[i]))
CENTER_X = WIDTH / 2
CENTER_Y = HEIGHT / 2
LENGTH = 10
for rad in radArr:
    x1 = CENTER_X
    y1 = CENTER_Y
    x2 = x1 + math.cos(rad) * LENGTH
    y2 = y1 + math.sin(rad) * LENGTH
    draw.line((x1, y1, x2, y2), fill=(255, 255, 255), width=1)
    LENGTH += 3 # 角度が変わる毎に長さを加算して角度の増える回転向きを確認しやすくしている

imgnp = np.array(img.convert('1')).astype(int)
plt.imshow(imgnp)
plt.show()
出力結果
[-3.141592653589793, -2.945243112740431, -2.748893571891069, -2.552544031041707, -2.356194490192345, -2.1598449493429825, -1.9634954084936207, -1.7671458676442586, -1.5707963267948966, -1.3744467859455345, -1.1780972450961724, -0.9817477042468106, -0.7853981633974483, -0.589048622548086, -0.39269908169872414, -0.1963495408493623, 0.0, 0.1963495408493623, 0.39269908169872414, 0.589048622548086, 0.7853981633974483, 0.9817477042468106, 1.178097245096172, 1.3744467859455343, 1.5707963267948966, 1.7671458676442588, 1.9634954084936211, 2.1598449493429825, 2.356194490192345, 2.552544031041707, 2.7488935718910685, 2.945243112740431]
radArr[0]=-3.141592653589793
radArr[4]=-2.356194490192345
radArr[8]=-1.5707963267948966
radArr[12]=-0.7853981633974483
radArr[16]=0.0
radArr[20]=0.7853981633974483
radArr[24]=1.5707963267948966
radArr[28]=2.356194490192345
角度が一段階変わる毎に線の長さを伸ばしてラジアンの値と見た目の角度をわかりやすくしています
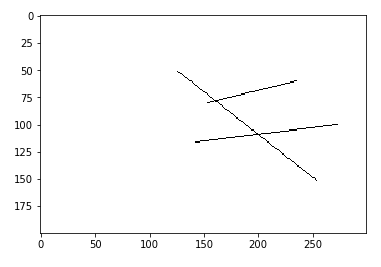
適当な図形(複数の線)を回転させてみる - サンプル作り
random.seed(0)
coord1 = (
    int(random.uniform(0, WIDTH)),
    int(random.uniform(0, HEIGHT)),
    int(random.uniform(0, WIDTH)),
    int(random.uniform(0, HEIGHT)),
)
coord2 = (
    int(random.uniform(0, WIDTH)),
    int(random.uniform(0, HEIGHT)),
    int(random.uniform(0, WIDTH)),
    int(random.uniform(0, HEIGHT)),
)
coord3 = (
    int(random.uniform(0, WIDTH)),
    int(random.uniform(0, HEIGHT)),
    int(random.uniform(0, WIDTH)),
    int(random.uniform(0, HEIGHT)),
)
img = create_image(WIDTH, HEIGHT)
draw = PIL.ImageDraw.Draw(img)
draw.line(coord1, fill=(255, 255, 255), width=1)
draw.line(coord2, fill=(255, 255, 255), width=1)
draw.line(coord3, fill=(255, 255, 255), width=1)
imgnp = np.array(img.convert('1')).astype(int)
plt.imshow(imgnp, cmap='binary', interpolation='nearest')
plt.show()
作った図形を回転させる
# 座標回転する機能を関数化しておく
def rotateCoordinate(centerX, centerY, x, y, rad):
    origRad = math.atan2(centerY - y, centerX - x) # 原点から座標の角度を出しておく(現在の角度)
    rad = origRad + rad # 現在の角度に新しい角度を加算する
    if rad > math.pi:
        rad = rad - math.pi * 2
    distance = math.sqrt((x - centerX) ** 2 + (y - centerY) ** 2)
    newX = centerX + math.cos(rad) * distance
    newY = centerY + math.sin(rad) * distance
    return newX, newY

# 対角線の幅を算出
diagonalWidth = math.ceil(math.sqrt(WIDTH ** 2 + HEIGHT ** 2))
print("diagonalWidth", diagonalWidth)
NEW_CENTER_X = int(diagonalWidth / 2)
NEW_CENTER_Y = int(diagonalWidth / 2)
# 画像幅が変わるため中心に寄せるための補正値を算出
CENTER_X_DIFF = NEW_CENTER_X - CENTER_X
CENTER_Y_DIFF = NEW_CENTER_Y - CENTER_Y
img = create_image(diagonalWidth, diagonalWidth)
draw = PIL.ImageDraw.Draw(img)

rad = radArr[23]
for coord in [coord1, coord2, coord3]:
    x1, y1 = rotateCoordinate(CENTER_X, CENTER_Y, coord[0], coord[1], rad)
    x2, y2 = rotateCoordinate(CENTER_X, CENTER_Y, coord[2], coord[3], rad)
    x1 += CENTER_X_DIFF
    y1 += CENTER_Y_DIFF
    x2 += CENTER_X_DIFF
    y2 += CENTER_Y_DIFF
    print((x1, y1, x2, y2))
    draw.line((x1, y1, x2, y2), fill=(255, 255, 255), width=1)

imgnp = np.array(img.convert('1')).astype(int)
plt.figure(dpi=100)
plt.imshow(imgnp, cmap='binary', interpolation='nearest')
plt.show()
出力結果
diagonalWidth 361
(209.9257461329035, 69.0295096956447, 136.62368898862877, 213.09827250846783)
(159.79902342588701, 180.95945059911287, 124.18591141249983, 104.43686404637057)
(197.2532870625807, 184.72483709096778, 156.19898071403233, 60.344195790805884)
回転後にはみ出ないように元画像サイズの対角線を縦横の長さにした新しい画像素体を準備しそこに描画します。
新しい幅に対して中心がずれるため CENTER_X_DIFF, CENTER_Y_DIFF 変数にて座標の補正を行います。
以上です


