音声有効区間とモーラの検出
MFCCを使って音声有効区間とモーラを検出します。ノイズ対策はありません、そのため録音時点でノイズが少ない音声を対象とした内容です。元論文等は特に無く独自のロジックです、音声界隈?で常套手段等あれば知りたいです。
py-webrtcvad というpython用ライブラリでも音声有効区間を検出することは可能ですが「サ行」の取りこぼし、喋り始めの取りこぼしが目立ちました。
py-webrtcvadについてですが前後に+50msくらい区間を広げる等工夫すれば十分実用可能と思います、実際 py-webrtcvad で特徴抽出をしてそこまで大きな問題はありませんでしたが今回はできる限り正確に喋り始めや発音の区切りを検出したかったため自作することにしました
本実験のソースは最後に載せます
サンプルによる実験結果
下記サイトでサンプル音声を作ります
文書は下記としました
吾輩は猫であるまだ名前はない。夏目漱石
わがはいはねこであるなまえはまだない なつめそうせき
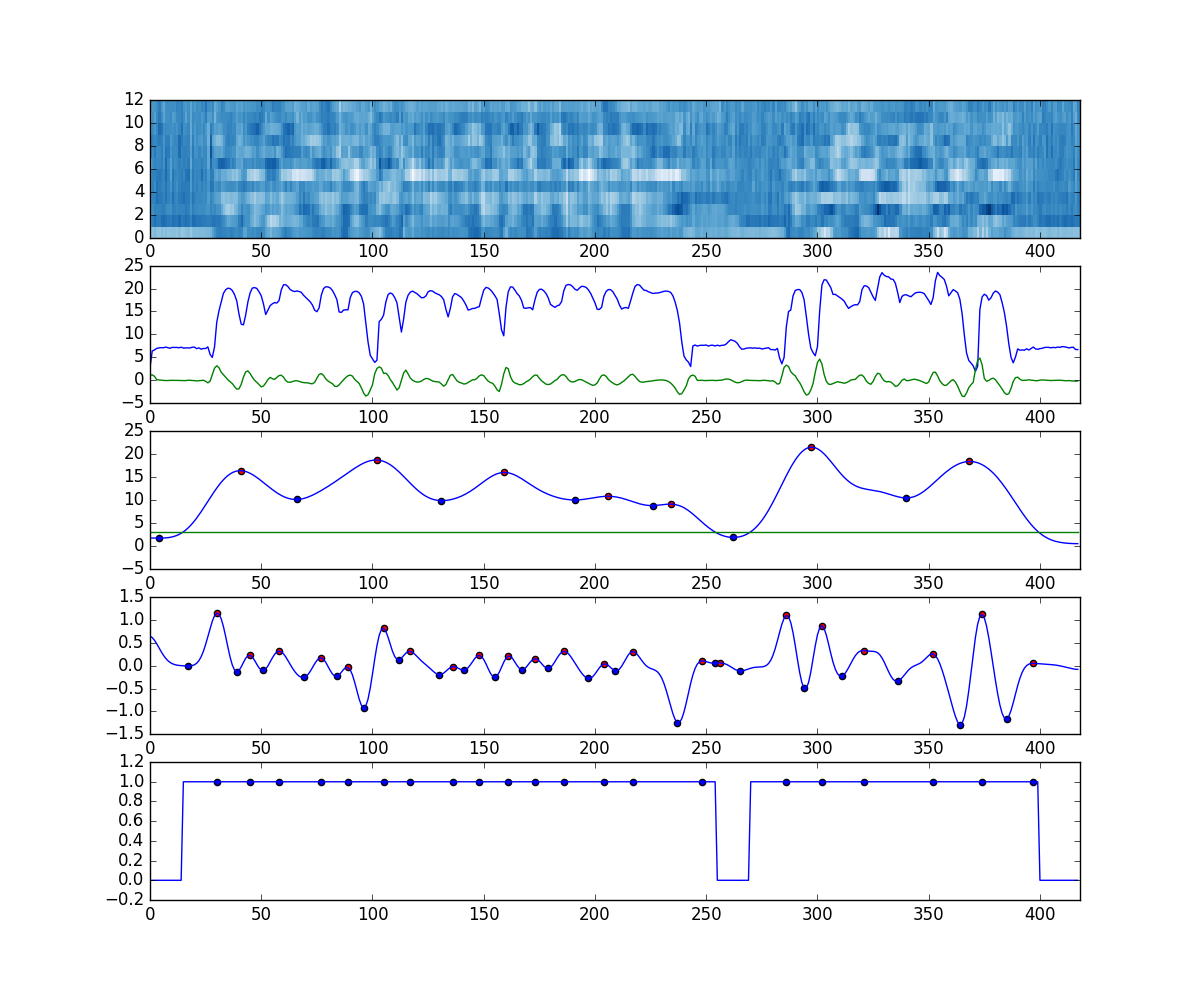
グラフは上から
- 「MFCCヒートマップ」
- 「MFCCパワー、MFCC⊿パワー」
- 「有効音声区間指標値」
- 「MFCC⊿のピーク」(モーラ指標)
- 「有効音声区間とモーラ」
グラフを見ると文字数(発音数?)とモーラがだいたい合っており検出できている事が確認できます。機械合成音で検出が容易ではありましたが人の録音音声に対しても同様に検出できることは確認しています。
音声有効区間の考え方
有効音声区間はMFCCパワーがありMFCC⊿に変動のある区間を有効音声区間とします、「音があって緩急があるのならそこは喋っている区間であろう」という考え方です。
有効なモーラの考え方
MFCC⊿変動の上のピークは全てモーラと考えるが有効音声区間内に限ります、当たり前ですがその他の区間のピークはモーラとは考えません。
音声有効区間の指標値の作り方
MFCCパワーの0を下回る数字を全て0へ丸めMFCC⊿を絶対値に変換した値を乗算、そこに分散10のガウシアンフィルタをかける。これによりパワーがありかつ変動のあるフレームが強調されたデータになります、データ中 ある閾値を上回っている箇所 全てを音声有効区間とします。
「ある閾値」とは2~10程度の整数になります、サンプル郡の平均的な静音区間を見て任意に決めます。元音声の周波数やサー音等の混ざり具合により変わります。
モーラの作り方
MFCCパワーとMFCC⊿パワーを掛け算して分散4のガウシアンフィルタをかけ上のピークをモーラとします
ソース
import matplotlib
matplotlib.use('Agg')
import matplotlib.pyplot as plot

import numpy as np
import python_speech_features as psf
import scipy
import scipy.io
import scipy.io.wavfile
import scipy.ndimage
import scipy.signal

def getMfcc(fileName):
    (rate, sig) = scipy.io.wavfile.read(fileName)
    mfcc = psf.mfcc(sig, rate)
    delta = psf.delta(mfcc, 2)
    deltaDelta = psf.delta(delta, 2)
    mfccFeature = np.c_[mfcc, delta, deltaDelta]
    return mfccFeature

def getVadFluctuation(mfccPower, deltaPower, filterWidth=10):
    mfccPower[mfccPower < 0] = 0
    deltaPower = np.abs(deltaPower)
    y = mfccPower * deltaPower
    y = scipy.ndimage.gaussian_filter(y, filterWidth)
    minId = scipy.signal.argrelmin(y, order=1)
    minPeek = np.zeros(len(y))
    minPeek[minId] = 1
    maxId = scipy.signal.argrelmax(y, order=1)
    maxPeek = np.zeros(len(y))
    maxPeek[maxId] = 1
    return y, minPeek, maxPeek

def getMoraFlactuation(mfccPower, deltaPower, filterWidth=4):
    y = mfccPower * deltaPower
    y = scipy.ndimage.gaussian_filter(deltaPower, filterWidth)
    minId = scipy.signal.argrelmin(y, order=1)
    minPeek = np.zeros(len(y))
    minPeek[minId] = 1
    maxId = scipy.signal.argrelmax(y, order=1)
    maxPeek = np.zeros(len(y))
    maxPeek[maxId] = 1
    return y, minPeek, maxPeek

def run():
    # defines
    vadThreshold = 3

    # MFCC取得
    mfcc = getMfcc("./sample1.wav")
    dataLength = len(mfcc)
    mfccPower = mfcc[:,0]
    deltaPower = mfcc[:,13]

    # Voice active detection
    vad, vadPeekMin, vadPeekMax = getVadFluctuation(mfccPower, deltaPower)

    # mora
    mora, moraPeekMin, moraPeekMax = getMoraFlactuation(mfccPower, deltaPower)

    # voice active detection
    vadSection = np.zeros(dataLength)
    vadSection[vad >= vadThreshold] = 1
    moraPositions = np.zeros(dataLength)
    moraPositions[np.where(moraPeekMax == 1)] = 1
    moraPositions[vad <= vadThreshold] = 0

    # plot data
    mfccHeatmap = mfcc[:,np.arange(1, 13)].T

    # max len
    xlim = [0, dataLength]

    plot.style.use('classic')
    plot.figure(figsize=(12,10))
    # heatmap
    plot.subplot(5, 1, 1)
    plot.xlim(xlim)
    #plot.heatmap(heatmap)
    plot.pcolor(mfccHeatmap, cmap=plot.cm.Blues)

    # power, delta
    plot.subplot(5, 1, 2)
    plot.xlim(xlim)
    plot.plot(mfccPower)
    plot.plot(deltaPower)

    # vad
    plot.subplot(5, 1, 3)
    plot.xlim(xlim)
    plot.plot(vad)
    sx = np.where(vadPeekMin == 1)[0]
    sy = vad[sx]
    plot.scatter(sx, sy, c="blue")
    sx = np.where(vadPeekMax == 1)[0]
    sy = vad[sx]
    plot.scatter(sx, sy, c="red")
    yline = [vadThreshold] * dataLength
    plot.plot(yline)

    # mora
    plot.subplot(5, 1, 4)
    plot.xlim(xlim)
    plot.plot(mora)
    sx = np.where(moraPeekMin == 1)[0]
    sy = mora[sx]
    plot.scatter(sx, sy, c="blue")
    sx = np.where(moraPeekMax == 1)[0]
    sy = mora[sx]
    plot.scatter(sx, sy, c="red")

    # vad
    plot.subplot(5, 1, 5)
    plot.xlim(xlim)
    plot.plot(vadSection)
    sx = np.where(moraPositions == 1)[0]
    sy = np.ones(len(sx))
    plot.scatter(sx, sy)
    #vadSection
    #moraPositions

    plot.savefig("./fig.png")


    vadThreashold = 2


if __name__ == "__main__":
    run()

"""
python main.py
"""
