この記事は 防災アプリ開発 Advent Calendar 2024 8日目の記事です。
こんにちは! iku55 です。
好きなミスドはエンゼルクリームです。あれはうまい。
緊急地震速報や地震情報等で台湾付近の地震を見ることがあると思います。台湾の地震情報が気になっている方は、「地牛Wake Up!」などのアプリを導入されているかもしれません。
この記事では、中央気象署(CWA)の地震情報を取得する方法について解説します。
※この記事内のプログラムは、速報性を担保することを目的としていません。速報性を重視するには、即時性のある他のAPIを使用したり、画像生成を最適化する必要があります。
中央気象署とは
中央気象署(CWA)は、気象観測や地震観測を行う台湾の行政機関で、日本で言う気象庁的な存在です。以前はCWBだった記憶があったので調べてみると、2023年9月に中央気象局(CWB)から中央気象署(CWA)に昇格したようです。
台湾の地震情報を見る方法
- 地牛Wake Up! (アプリケーション) - 強震即時警報、地震情報を確認できるアプリ
- 台灣地震監視 (YouTubeライブ) - 地牛Wake Up!のチームが運営する地震監視ライブ
- TREM (アプリケーション) - コミュニティ地震観測網を合わせて表示するアプリ
本題
先ほど紹介したようなアプリで見ることができる、中央気象署の地震情報を取得する方法について解説していきます。
中央気象局のオープンデータAPIに登録する
ここでは、地震情報を中央気象署のオープンデータAPIを使用して取得します。まずは以下のリンクから、中央気象署の会員登録をします。
次に、中央気象署のオープンデータプラットフォームページから先程のメールアドレス・パスワードでログインします。
そして、以下のスクリーンショットのように「API~」から「取得~」を押してAPIキーを取得します。これは後で使用するのでメモしておいてください。

地震情報を取得する
ここでは、以下の環境でコードを書いていきます。ご自身の環境に合わせてコードを書き換えてください。
Windows 11 23H2
Node.js v20.18.0
※JavaScript モジュール (*.mjs)を使用します。
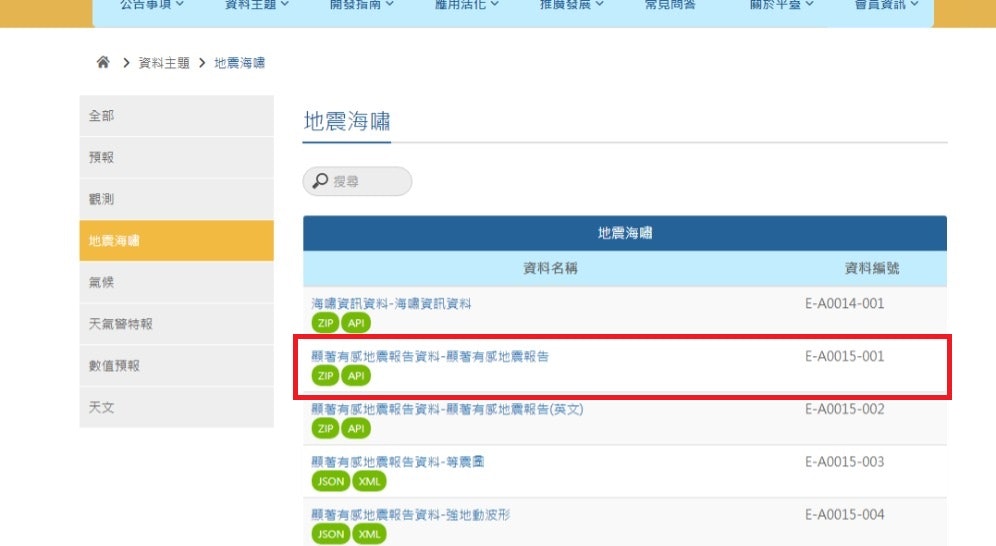
「資料主題」>「地震海嘯」で地震・津波関係のオープンデータ一覧が確認できます。
ここでは、「顯著有感地震報告資料-顯著有感地震報告」(日本語でいうと顕著な地震に関する情報、とかでしょうか)のAPIを使用します。ライセンスは「Open Government Data License」となっており、出典を表示してのデータ利用が可能です。
次のコードは、地震情報の1番目(最新)の内容を出力するコードです。
("APIキー"を自分のAPIキーに置き換えて実行してください)
async function fetchEarthquakes(apikey) {
    const request = await fetch('https://opendata.cwa.gov.tw/api/v1/rest/datastore/E-A0015-001?Authorization='+apikey);
    if (request.status == 401) { throw Error('APIキーが無効です'); }
    if (!request.ok) { throw Error(); }
    const earthquakes = await request.json();
    if (!earthquakes.success) { throw Error(); }
    return earthquakes;
}
console.log((await fetchEarthquakes(APIキー)).records.Earthquake[0]);
> node .\fetchEarthquakes.mjs
{
  EarthquakeNo: 113506,
  ReportType: '地震報告',
  ReportColor: '綠色',
  ReportContent: '11/27-23:32花蓮縣近海發生規模5.2有感地震,最大震度花蓮縣花蓮市、宜蘭縣南澳、南投縣合 歡山、臺中市梨山3級。',
  ReportImageURI: 'https://scweb.cwa.gov.tw/webdata/OLDEQ/202411/2024112723322452506_H.png',
  ReportRemark: '本報告係中央氣象署地震觀測網即時地震資料地震速報之結果。',
  Web: 'https://scweb.cwa.gov.tw/zh-tw/earthquake/details/2024112723322452506',
  ShakemapImageURI: 'https://scweb.cwa.gov.tw/webdata/drawTrace/plotContour/2024/2024506i.png',
  EarthquakeInfo: {
    OriginTime: '2024-11-27 23:32:24',
    Source: '中央氣象署',
    FocalDepth: 41.1,
    Epicenter: {
      Location: '花蓮縣政府東北方  10.2  公里 (位於花蓮縣近海)',
      EpicenterLatitude: 24.06,
      EpicenterLongitude: 121.69
    },
    EarthquakeMagnitude: { MagnitudeType: '芮氏規模', MagnitudeValue: 5.2 }
  },
  Intensity: {
    ShakingArea: [
      [Object], [Object], [Object],
      [Object], [Object], [Object],
      [Object], [Object], [Object],
      [Object], [Object], [Object],
      [Object], [Object], [Object],
      [Object], [Object], [Object],
      [Object], [Object], [Object]
    ]
  }
}
APIの返却データはJSON形式で、records.Earthquakeに地震情報のリストがあります。
地震情報の各データについて簡単に説明すると、
EarthquakeNo: 地震番号
EarthquakeInfo.OriginTime: 地震の発生日時
EarthquakeInfo.Epicenter.EpicenterLatitude: 震源の緯度
EarthquakeInfo.Epicenter.EpicenterLongitude: 震源の経度
EarthquakeInfo.Epicenter.EarthquakeMagnitude.MagnitudeValue: マグニチュード
Intensity.ShakingArea[]: 地域ごとの観測震度
Intensity.ShakingArea[].EqStation[]: 観測点ごとの観測震度
となっています。
次章では、このデータをもとに震度分布図を生成していきます。
震度分布図を生成する
先駆者の方の記事を参考に開発していきます。
ここでは、震度分布図の生成にJSDOMとd3.js、SVGからpngへの変換にresvg-jsを使用します。
> npm install d3 jsdom @resvg/resvg-js
地図データを用意する
震度分布図の生成には、観測点の緯度/経度と、台湾の地図データが必要です。
観測点の緯度/経度は先程の地震情報データに含まれますが、地図データは含まれないので、どこかからダウンロードしてくる必要があります。
今回は、地図データにNaturalEarthを使用します。
NaturalEarthのダウンロードサイトにアクセスし、1:10m Cultural VectorsのAdmin 1 – States, Provincesをダウンロードします。
補足: 政府オープンデータの地図データを使用する方法
以前は政府オープンデータの地図データを使用していましたが、記事執筆時点で、ダウンロード先がタイムアウトし、ダウンロードができませんでしたので、NaturalEarthを紹介しています。
こちらの方法も紹介しておきますので、ダウンロード可能でしたら参考にしてください。
台湾政府が公式に用意しているオープンデータの地図データを使用します。
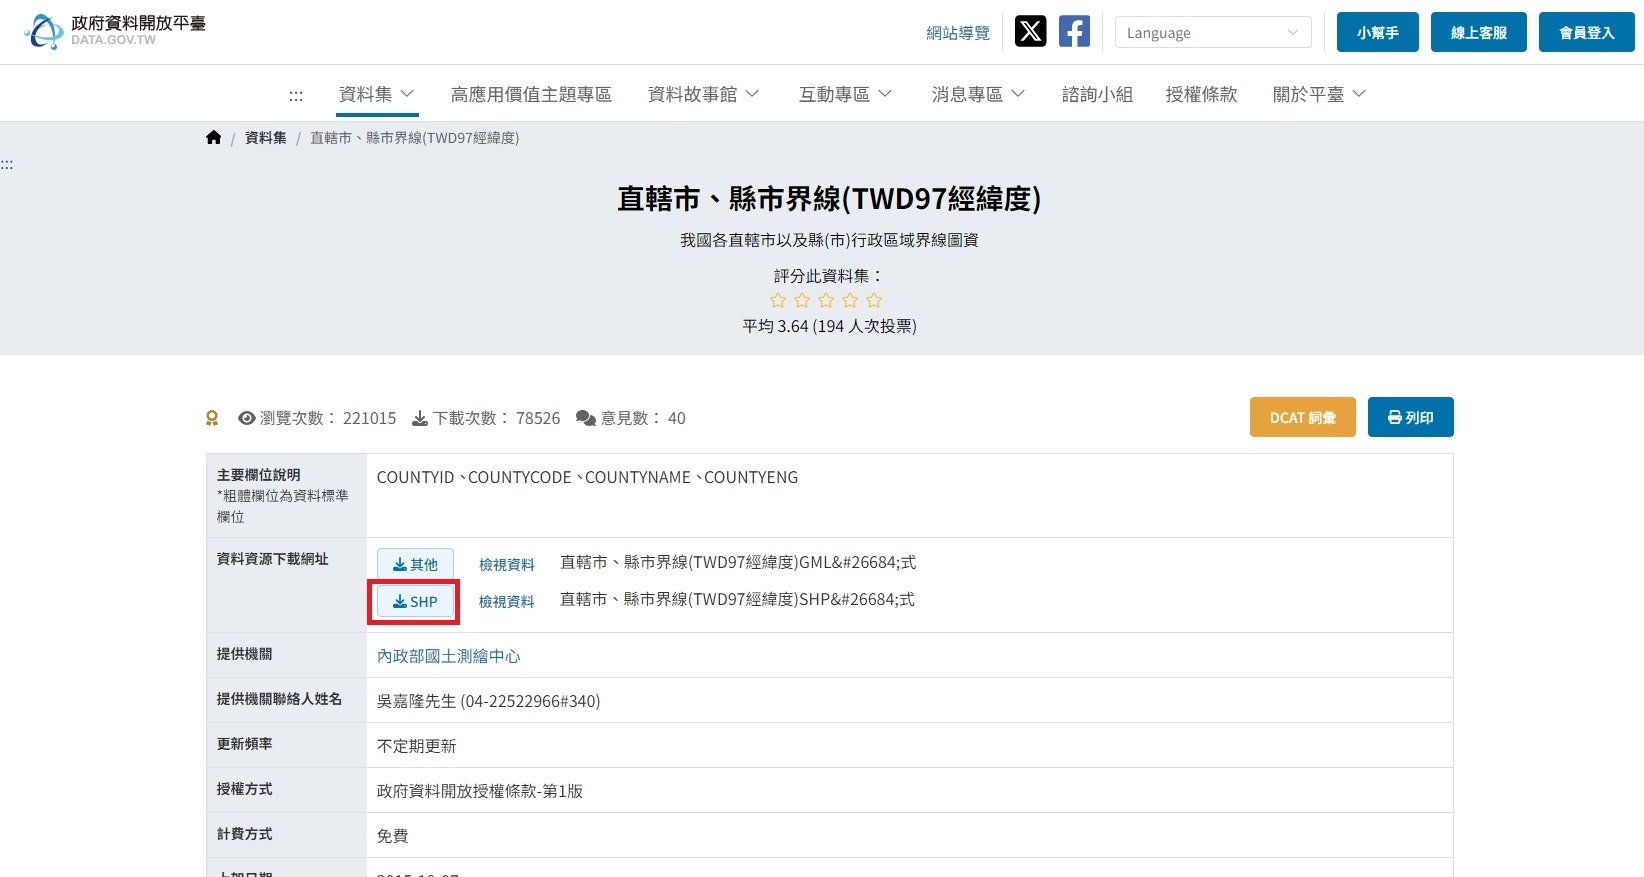
オープンデータサイト(政府資料開放平臺)にアクセスし、シェープファイルをダウンロードします。
ダウンロードしたファイルを展開し、シェープファイルをQGISで読み込みます。
簡略化した後、GeoJSONに変換して保存しておきます。
(この記事では作業ディレクトリにmap.geojsonとして保存します。)
d3.jsを使用して地図を描画
まずは、先程の地図データを描画してみます。
地図データを読み込みます。
import * as d3 from "d3";
import * as fs from 'fs';
import { JSDOM } from 'jsdom';

const geoData = JSON.parse(fs.readFileSync('map.geojson'));
// 地図データ(GeoJSON)の保存先はmap.geojsonです。
キャンバスを準備します。
const document = new JSDOM().window.document;
const svg = d3.select(document.body).append('svg');

const width = 1920; // 画像サイズ横
const height = 1080; // 画像サイズ縦

svg.attr('width', width)
    .attr('height', height)
    .attr('xmlns', 'http://www.w3.org/2000/svg')
    .attr('xmlns:xlink', 'http://www.w3.org/1999/xlink');

//背景を描画
svg.append('rect')
    .attr('x', 0)
    .attr('y', 0)
    .attr('width', width)
    .attr('height', height)
    .style('fill', '#ddd'); // 背景色
地図を描画します。
// 中央位置・ズームレベルの決定
var projection = d3.geoMercator()
    .scale(12000) // ズームレベル
    .center([121, 23.5]) // 中央位置
    .translate([width / 2, height / 2]);

var path = d3.geoPath()
    .projection(projection);

// 地図を描画
svg.selectAll('path')
    .data(geoData.features)
    .enter()
    .append('path')
    .attr('d', path)
    .style('fill', '#fff') // 塗りつぶし色
    .style("stroke", '#222') // 境界線色
    .style("stroke-width", "1.5px"); // 境界線の太さ
SVGをout.svgに出力します。
fs.writeFileSync('out.svg', document.body.innerHTML);
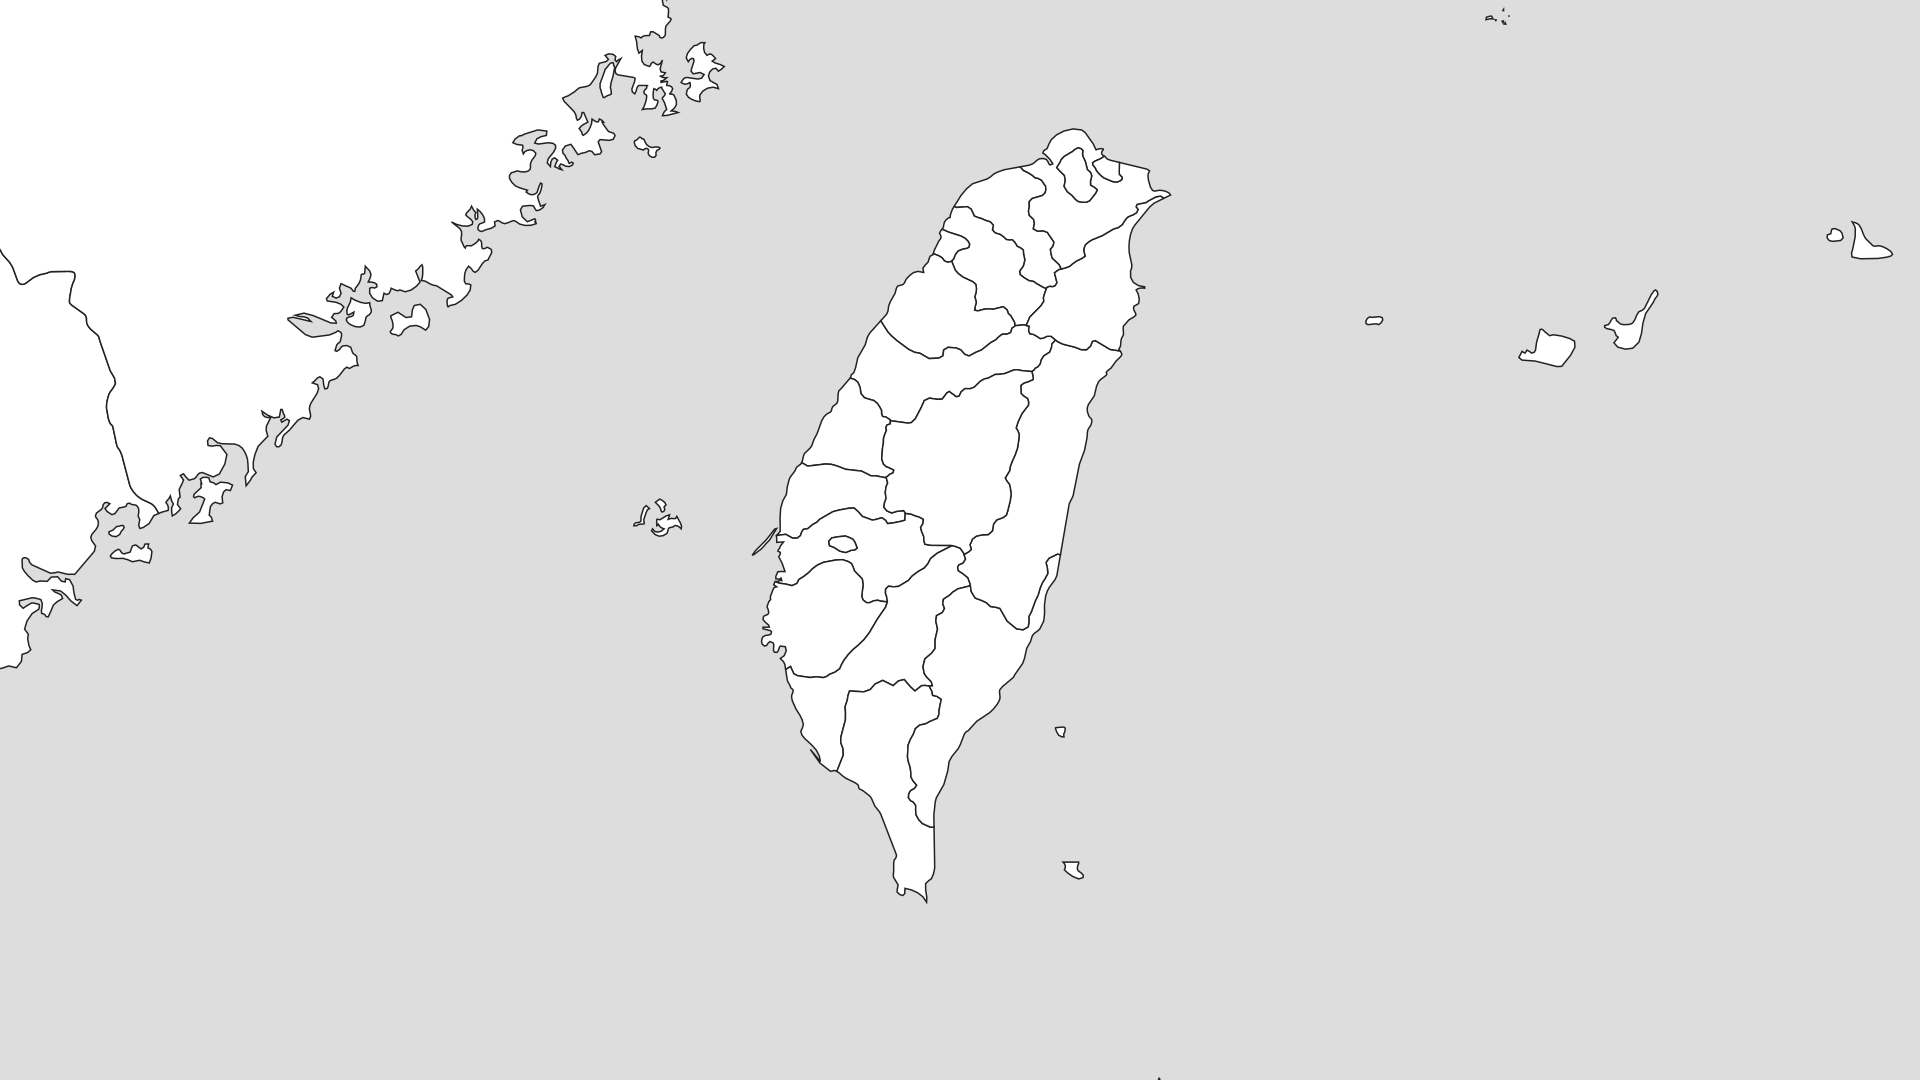
実行するとout.svgが生成され、地図データが描画されたことが確認できると思います。
> node .\drawMap.mjs
全体のコード
import * as d3 from "d3";
import * as fs from 'fs';
import { JSDOM } from 'jsdom';

const geoData = JSON.parse(fs.readFileSync('map.geojson'));
// 地図データ(GeoJSON)の保存先はmap.geojsonです。

const document = new JSDOM().window.document;
const svg = d3.select(document.body).append('svg');

const width = 1920; // 画像サイズ横
const height = 1080; // 画像サイズ縦

svg.attr('width', width)
    .attr('height', height)
    .attr('xmlns', 'http://www.w3.org/2000/svg')
    .attr('xmlns:xlink', 'http://www.w3.org/1999/xlink');

//背景を描画
svg.append('rect')
    .attr('x', 0)
    .attr('y', 0)
    .attr('width', width)
    .attr('height', height)
    .style('fill', '#ddd'); // 背景色

// 中央位置・ズームレベルの決定
var projection = d3.geoMercator()
    .scale(12000) // ズームレベル
    .center([121, 23.5]) // 中央位置
    .translate([width / 2, height / 2]);

var path = d3.geoPath()
    .projection(projection);

// 地図を描画
svg.selectAll('path')
    .data(geoData.features)
    .enter()
    .append('path')
    .attr('d', path)
    .style('fill', '#fff') // 塗りつぶし色
    .style("stroke", '#222') // 境界線色
    .style("stroke-width", "1.5px"); // 境界線の太さ

fs.writeFileSync('out.svg', document.body.innerHTML);
震度データを地図に表示
先程のプログラムに追記していきます。
地震情報データを取得します。
// 関数は略
const earthquakes = await fetchEarthquakes(APIキー);
const earthquake = earthquakes.records.Earthquake[0]; // 描画する地震
観測点の座標と震度をもとに震度をマッピングします。
const fillColors = {
    '7級': "#780078",
    "6強": "#960000",
    "6弱": "#BE0000",
    "5強": "#FF6400",
    "5弱": "#FF9600",
    "4級": "#E1AF05",
    "3級": "#00c878",
    "2級": "#3264C8",
    "1級": "#646464"
}; // 塗りつぶし色を震度階級ごとに書いておく

for (const area of earthquake.Intensity.ShakingArea) {
    if (area.AreaDesc.includes('最大震度')) {
        continue; // テキスト化用と思われる地域があるので無視する("最大震度4の地域":"〇〇県、〇〇市"みたいな感じ)
    }
    console.log('[地域]', area.CountyName, ':', area.AreaIntensity);
    for (const station of area.EqStation) {
        console.log('[観測点]', station.StationName, ':', station.SeismicIntensity);
        svg.append('rect')
            .attr('x', () => { return projection([station.StationLongitude, station.StationLatitude])[0]-5 })
            .attr('y', () => { return projection([station.StationLongitude, station.StationLatitude])[1]-5 })
            .attr('width', '10')
            .attr('height', '10')
            .attr('fill', fillColors[station.SeismicIntensity]);
    }
}
震源地を表示します。
svg.append("defs")
    .append("path")
    .attr("id", "Center")
    .attr("x", 0)
    .attr("y", 0)
    .attr("d", "M-20-14-6 0-20 14-14 20 0 6 14 20 20 14 6 0 20-14 14-20 0-6-14-20-20-14Z")
    .attr("fill", "#990000")
    .attr('stroke', '#fff')
    .attr('stroke-width', '3'); // 震源のバツ印を定義

svg.append("use")
    .attr("x", () => { return projection([earthquake.EarthquakeInfo.Epicenter.EpicenterLongitude, earthquake.EarthquakeInfo.Epicenter.EpicenterLatitude])[0]; })
    .attr("y", () => { return projection([earthquake.EarthquakeInfo.Epicenter.EpicenterLongitude, earthquake.EarthquakeInfo.Epicenter.EpicenterLatitude])[1]; })
    .attr("xlink:href", "#Center");
SVGをPNG形式に変換し、out.pngに保存します。
import { Resvg } from '@resvg/resvg-js';

const resvg = new Resvg(document.body.innerHTML);
const pngData = resvg.render();
fs.writeFileSync('out.png', pngData.asPng());
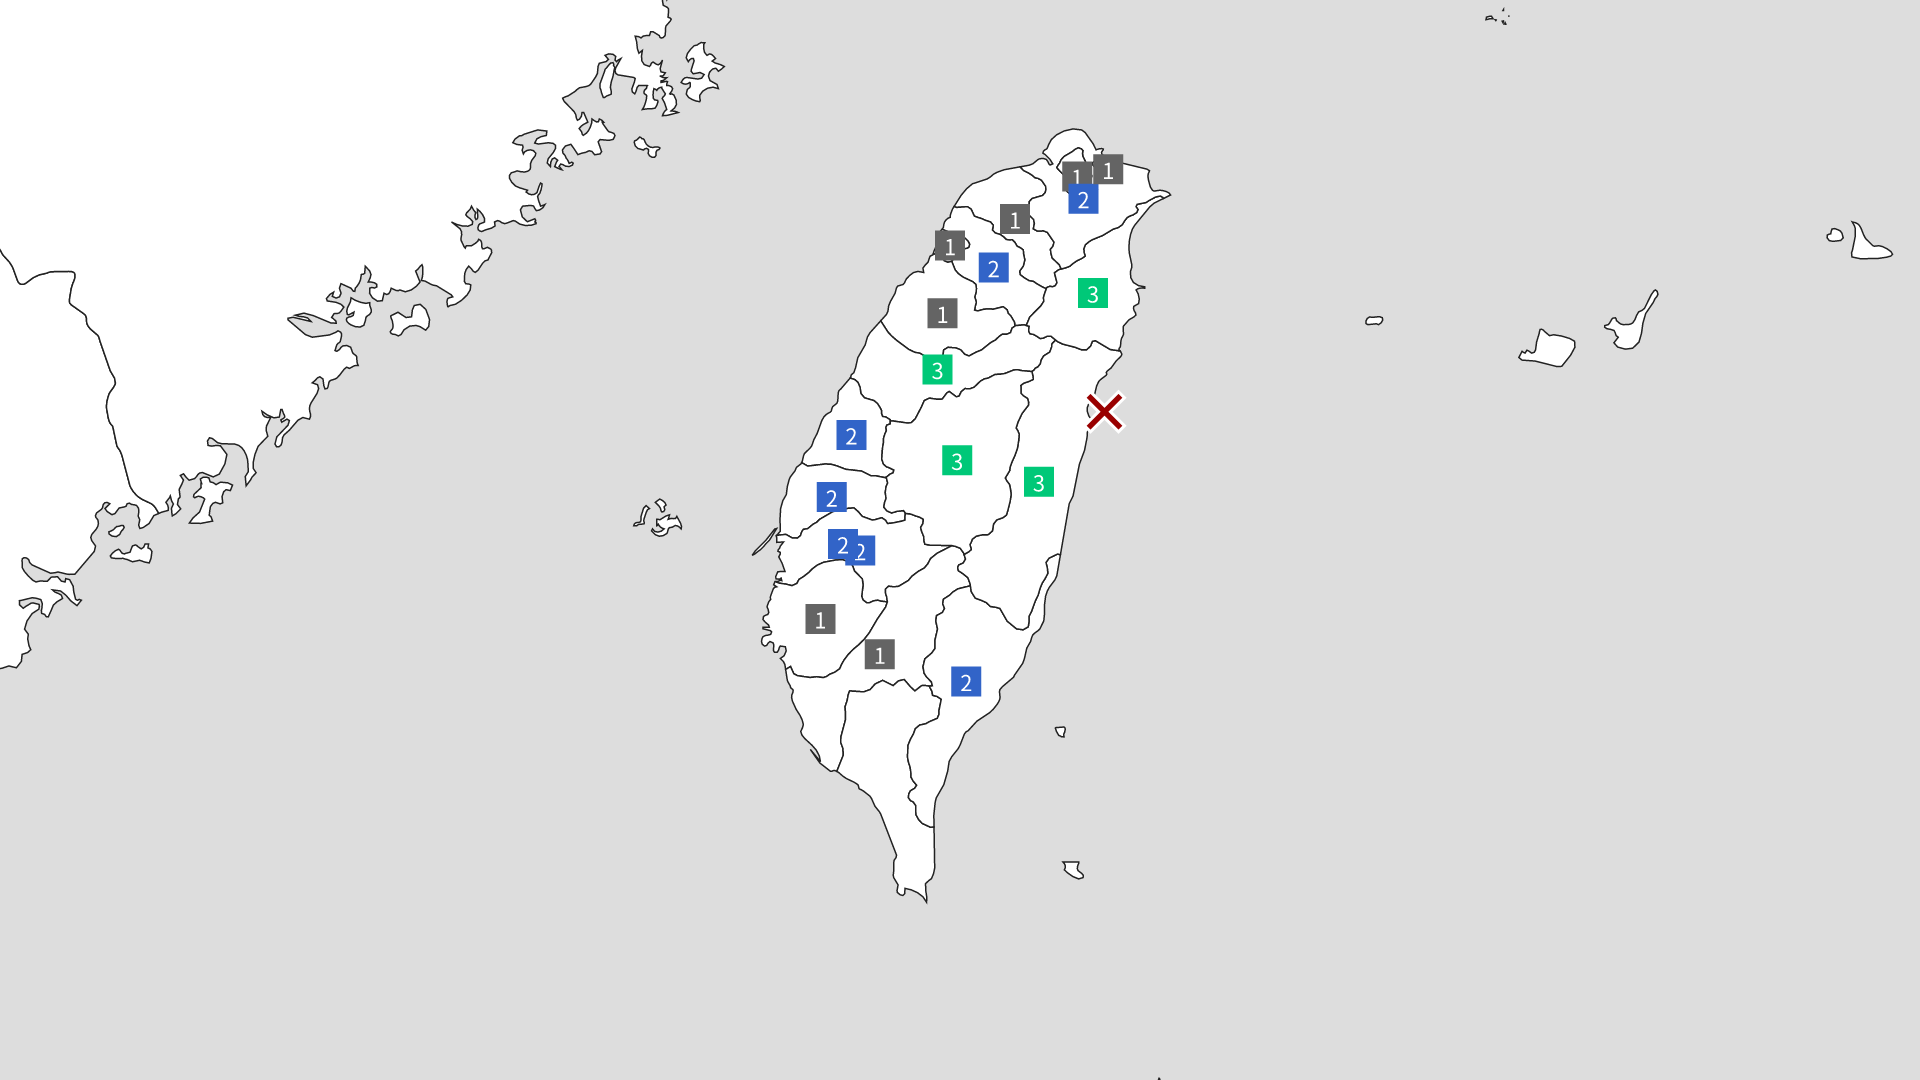
実行してみます。
> node .\drawIntensity.mjs
[地域] 南投縣 : 3級
[観測点] 合歡山 : 3級
[観測点] 奧萬大 : 2級
[観測点] 信義鄉 : 2級
[観測点] 埔里 : 1級
[観測点] 國姓 : 1級
[観測点] 日月潭 : 1級
[観測点] 竹山 : 1級
[観測点] 南投市 : 1級
[観測点] 名間 : 1級
[観測点] 玉山 : 1級
[地域] 高雄市 : 1級
[観測点] 桃源 : 1級
[観測点] 旗山 : 1級
...
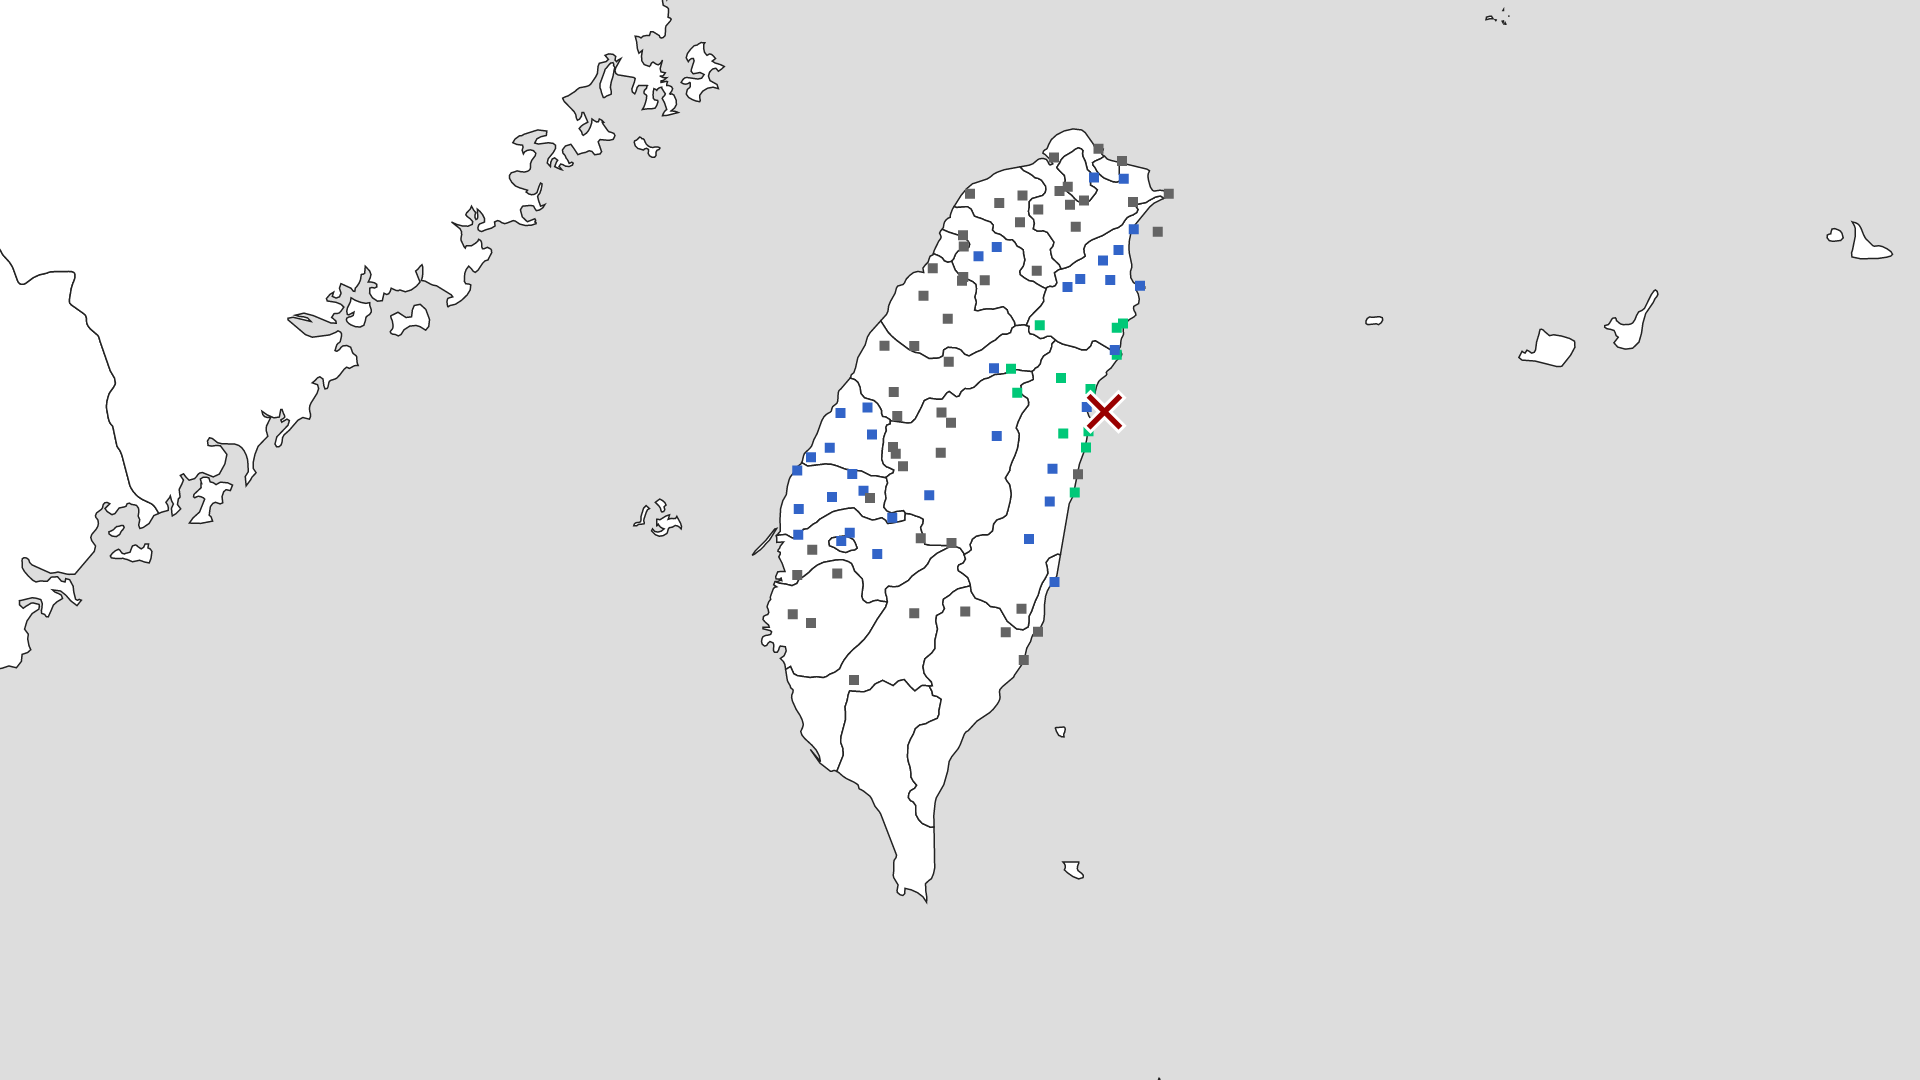
震度分布図がout.pngに出力されました!完成です。
コード全体
import * as d3 from "d3";
import * as fs from 'fs';
import { JSDOM } from 'jsdom';
import { Resvg } from '@resvg/resvg-js';

// 地図データを読み込み
const geoData = JSON.parse(fs.readFileSync('map.geojson'));

// JSDOM上でSVG要素を作成
const document = new JSDOM().window.document;
const svg = d3.select(document.body).append('svg');

const width = 1920; // 画像サイズ横
const height = 1080; // 画像サイズ縦

svg.attr('width', width)
    .attr('height', height)
    .attr('xmlns', 'http://www.w3.org/2000/svg')
    .attr('xmlns:xlink', 'http://www.w3.org/1999/xlink');

//背景を描画
svg.append('rect')
    .attr('x', 0)
    .attr('y', 0)
    .attr('width', width)
    .attr('height', height)
    .style('fill', '#ddd'); // 背景色

// 中央位置・ズームレベルの決定
var projection = d3.geoMercator()
    .scale(12000) // ズームレベル
    .center([121, 23.5]) // 中央位置
    .translate([width / 2, height / 2]);

var path = d3.geoPath()
    .projection(projection);

// 地図を描画
svg.selectAll('path')
    .data(geoData.features)
    .enter()
    .append('path')
    .attr('d', path)
    .style('fill', '#fff') // 塗りつぶし色
    .style("stroke", '#222') // 境界線色
    .style("stroke-width", "1.5px"); // 境界線の太さ

// 地震情報取得関数
async function fetchEarthquakes(apikey) {
    const request = await fetch('https://opendata.cwa.gov.tw/api/v1/rest/datastore/E-A0015-001?Authorization='+apikey);
    if (request.status == 401) { throw Error('APIキーが無効です'); }
    if (!request.ok) { throw Error(); }
    const earthquakes = await request.json();
    if (!earthquakes.success) { throw Error(); }
    return earthquakes;
}

// 地震情報取得
const earthquakes = await fetchEarthquakes(APIキー);
const earthquake = earthquakes.records.Earthquake[0];

// 観測点マッピング
const fillColors = {
    '7級': "#780078",
    "6強": "#960000",
    "6弱": "#BE0000",
    "5強": "#FF6400",
    "5弱": "#FF9600",
    "4級": "#E1AF05",
    "3級": "#00c878",
    "2級": "#3264C8",
    "1級": "#646464"
}; // 塗りつぶし色を震度階級ごとに書いておく

for (const area of earthquake.Intensity.ShakingArea) {
    if (area.AreaDesc.includes('最大震度')) {
        continue; // テキスト化用と思われる地域があるので無視する("最大震度4の地域":"〇〇県、〇〇市"みたいな感じ)
    }
    console.log('[地域]', area.CountyName, ':', area.AreaIntensity);
    for (const station of area.EqStation) {
        console.log('[観測点]', station.StationName, ':', station.SeismicIntensity);
        svg.append('rect')
            .attr('x', projection([station.StationLongitude, station.StationLatitude])[0]-5)
            .attr('y', projection([station.StationLongitude, station.StationLatitude])[1]-5)
            .attr('width', '10')
            .attr('height', '10')
            .attr('fill', fillColors[station.SeismicIntensity]);
    }
}

// 震源地表示
svg.append("defs")
    .append("path")
    .attr("id", "Center")
    .attr("x", 0)
    .attr("y", 0)
    .attr("d", "M-20-14-6 0-20 14-14 20 0 6 14 20 20 14 6 0 20-14 14-20 0-6-14-20-20-14Z")
    .attr("fill", "#990000")
    .attr('stroke', '#fff')
    .attr('stroke-width', '3'); // 震源のバツ印を定義

svg.append("use")
    .attr("x", projection([earthquake.EarthquakeInfo.Epicenter.EpicenterLongitude, earthquake.EarthquakeInfo.Epicenter.EpicenterLatitude])[0])
    .attr("y", projection([earthquake.EarthquakeInfo.Epicenter.EpicenterLongitude, earthquake.EarthquakeInfo.Epicenter.EpicenterLatitude])[1])
    .attr("xlink:href", "#Center");

// SVG->PNG変換
const resvg = new Resvg(document.body.innerHTML);
const pngData = resvg.render();
fs.writeFileSync('out.png', pngData.asPng());
発展編: 地域別の震度分布図を生成する
せっかくなので、地域別の震度分布図も作りたいと思います。
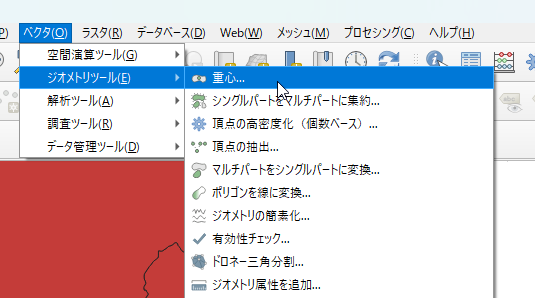
QGISで各地域の重心を求めて、centroids.geojsonに保存しておきます。
ただし、台中市のプロパティname_zshは臺中市に修正します。
前の章の観測点をマッピングする部分を次のように変えていきます。
const fillColors = {
    '7級': "#780078",
    "6強": "#960000",
    "6弱": "#BE0000",
    "5強": "#FF6400",
    "5弱": "#FF9600",
    "4級": "#E1AF05",
    "3級": "#00c878",
    "2級": "#3264C8",
    "1級": "#646464"
}; // 塗りつぶし色を震度階級ごとに書いておく
const intensityTexts = {
    '7級': "7",
    "6強": "6+",
    "6弱": "6-",
    "5強": "5+",
    "5弱": "5-",
    "4級": "4",
    "3級": "3",
    "2級": "2",
    "1級": "1"
}; // テキストを震度階級ごとに書いておく

// 重心ファイル読み込み
const centroids = JSON.parse(fs.readFileSync('centroids.geojson')).features;
var areas = {};
for (const area of earthquake.Intensity.ShakingArea) {
    if (area.AreaDesc.includes('最大震度')) {
        continue; // テキスト化用と思われる地域があるので無視する("最大震度4の地域":"〇〇県、〇〇市"みたいな感じ)
    }
    areas[area.CountyName] = area.AreaIntensity;
}
for (const area of Object.entries(areas)) {
    console.log(area, centroids.find(d => d.properties.name_zht == area[0]))
    svg.append('rect')
        .attr('x', projection(centroids.find(d => d.properties.name_zht == area[0]).geometry.coordinates)[0]-15)
        .attr('y', projection(centroids.find(d => d.properties.name_zht == area[0]).geometry.coordinates)[1]-15)
        .attr('width', '30')
        .attr('height', '30')
        .attr('fill', fillColors[area[1]]);
    svg.append('text')
        .attr('x', projection(centroids.find(d => d.properties.name_zht == area[0]).geometry.coordinates)[0])
        .attr('y', projection(centroids.find(d => d.properties.name_zht == area[0]).geometry.coordinates)[1])
        .attr('text-anchor','middle')
        .attr('dominant-baseline', 'central')
        .attr('fill', '#ffffff')
        .attr('font-family', '"Noto Sans JP", sans-serif')
        .attr('font-size', '22px')
        .text(intensityTexts[area[1]]);
}
実行してみます。
> node .\drawArea.mjs
コード全体
import * as d3 from "d3";
import * as fs from 'fs';
import { JSDOM } from 'jsdom';
import { Resvg } from '@resvg/resvg-js';

// 地図データを読み込み
const geoData = JSON.parse(fs.readFileSync('map.geojson'));

// JSDOM上でSVG要素を作成
const document = new JSDOM().window.document;
const svg = d3.select(document.body).append('svg');

const width = 1920; // 画像サイズ横
const height = 1080; // 画像サイズ縦

svg.attr('width', width)
    .attr('height', height)
    .attr('xmlns', 'http://www.w3.org/2000/svg')
    .attr('xmlns:xlink', 'http://www.w3.org/1999/xlink');

//背景を描画
svg.append('rect')
    .attr('x', 0)
    .attr('y', 0)
    .attr('width', width)
    .attr('height', height)
    .style('fill', '#ddd'); // 背景色

// 中央位置・ズームレベルの決定
var projection = d3.geoMercator()
    .scale(12000) // ズームレベル
    .center([121, 23.5]) // 中央位置
    .translate([width / 2, height / 2]);

var path = d3.geoPath()
    .projection(projection);

// 地図を描画
svg.selectAll('path')
    .data(geoData.features)
    .enter()
    .append('path')
    .attr('d', path)
    .style('fill', '#fff') // 塗りつぶし色
    .style("stroke", '#222') // 境界線色
    .style("stroke-width", "1.5px"); // 境界線の太さ

// 地震情報取得関数
async function fetchEarthquakes(apikey) {
    const request = await fetch('https://opendata.cwa.gov.tw/api/v1/rest/datastore/E-A0015-001?Authorization='+apikey);
    if (request.status == 401) { throw Error('APIキーが無効です'); }
    if (!request.ok) { throw Error(); }
    const earthquakes = await request.json();
    if (!earthquakes.success) { throw Error(); }
    return earthquakes;
}

// 地震情報取得
const earthquakes = await fetchEarthquakes(APIキー);
const earthquake = earthquakes.records.Earthquake[0];

// 観測点マッピング
const fillColors = {
    '7級': "#780078",
    "6強": "#960000",
    "6弱": "#BE0000",
    "5強": "#FF6400",
    "5弱": "#FF9600",
    "4級": "#E1AF05",
    "3級": "#00c878",
    "2級": "#3264C8",
    "1級": "#646464"
}; // 塗りつぶし色を震度階級ごとに書いておく
const intensityTexts = {
    '7級': "7",
    "6強": "6+",
    "6弱": "6-",
    "5強": "5+",
    "5弱": "5-",
    "4級": "4",
    "3級": "3",
    "2級": "2",
    "1級": "1"
}; // テキストを震度階級ごとに書いておく

// 震度マッピング
// 重心ファイル読み込み
const centroids = JSON.parse(fs.readFileSync('centroids.geojson')).features;
var areas = {};
for (const area of earthquake.Intensity.ShakingArea) {
    if (area.AreaDesc.includes('最大震度')) {
        continue; // テキスト化用と思われる地域があるので無視する("最大震度4の地域":"〇〇県、〇〇市"みたいな感じ)
    }
    areas[area.CountyName] = area.AreaIntensity;
}
for (const area of Object.entries(areas)) {
    svg.append('rect')
        .attr('x', projection(centroids.find(d => d.properties.name_zht == area[0]).geometry.coordinates)[0]-15)
        .attr('y', projection(centroids.find(d => d.properties.name_zht == area[0]).geometry.coordinates)[1]-15)
        .attr('width', '30')
        .attr('height', '30')
        .attr('fill', fillColors[area[1]]);
    svg.append('text')
        .attr('x', projection(centroids.find(d => d.properties.name_zht == area[0]).geometry.coordinates)[0])
        .attr('y', projection(centroids.find(d => d.properties.name_zht == area[0]).geometry.coordinates)[1])
        .attr("text-anchor","middle")
        .attr('dominant-baseline', 'central')
        .attr('fill', '#ffffff')
        .attr('font-family', '"Noto Sans JP", sans-serif')
        .attr('font-size', '22px')
        .text(intensityTexts[area[1]]);
}

// 震源地表示
svg.append("defs")
    .append("path")
    .attr("id", "Center")
    .attr("x", 0)
    .attr("y", 0)
    .attr("d", "M-20-14-6 0-20 14-14 20 0 6 14 20 20 14 6 0 20-14 14-20 0-6-14-20-20-14Z")
    .attr("fill", "#990000")
    .attr('stroke', '#fff')
    .attr('stroke-width', '3'); // 震源のバツ印を定義

svg.append("use")
    .attr("x", projection([earthquake.EarthquakeInfo.Epicenter.EpicenterLongitude, earthquake.EarthquakeInfo.Epicenter.EpicenterLatitude])[0])
    .attr("y", projection([earthquake.EarthquakeInfo.Epicenter.EpicenterLongitude, earthquake.EarthquakeInfo.Epicenter.EpicenterLatitude])[1])
    .attr("xlink:href", "#Center");

// SVG->PNG変換
const resvg = new Resvg(document.body.innerHTML);
const pngData = resvg.render();
fs.writeFileSync('out2.png', pngData.asPng());
おわりに
ここまで見てくださりありがとうございました。結構雑な記事になってしまったかもしれませんが、参考になればと思います。
分かりづらいところなどありましたら、僕で良ければTwitterなどで聞いて下さい...
この記事で使用したソースコードはGitHubにおいておきますので、よかったら使ってください。
また、あわせて、CWAの地震情報の震度分布図を生成するコマンドラインツール「CWA-EQImage-Generator」を公開しましたので、よろしければ、こちらも参考にしてください。(というか使ってください...)
今年もありがとうございました。来年もよろしくお願いします。
翌9日目は、いちはいさんの「【C#】今更ながらWxBeacon2のデータをPCで受信しよう(簡易版)」です。
※この記事の内容には、中央気象署のデータが含まれます。Open Government Data Licenseに基づいて利用しました。
※この記事の画像には、NaturalEarthのデータを使用したものが含まれます。
