Zabbixの3.4.5からZabbixの監視結果の格納先としてダイレクトにElasticsearchを選択できるようになりました。
これまでは、fluentdとか使って、Zabbixでの監視用とログ結果の分析用といった感じで処理を分けて管理しなければならなかったところが、Zabbixの機能だけでElasticsearchとうまく連携できるようになっています。
Zabbixはこれまでログ監視・分析系が少し弱いところがあったので、これでかなり監視結果データの活用がやりやすくなったのではないでしょうか。
詳しくはこちらのZabbix社の公式ドキュメントに記載があります。
では、以下、使う方法について解説します。
ZabbixとElasticsearchのインストール
導入手順は省略しますが、普通にそれぞれインストールします。
ZabbixからElasticsearchのWeb APIを呼び出せるよう通信許可が必要です。(ESのデフォルトだとhttp://elasticsearchのホスト:9200)
なお今回、試した各バージョンは以下です。
- Zabbix: 4.0.0 α3
- Elasticsearch: 5.6.7
Zabbix Serverの設定変更
zabbix_server.confに新たにHistoryStorageURLとHistoryStorageTypesの2設定項目が追加されています。
HistoryStorageURL=http://Elasticsearchのホスト名orIP:9200
HistoryStorageTypes=str,log,text
HistoryStorageURLに、ElasticsearchのAPIのURLを、HistoryStorageTypesにElasticsearchで管理したいデータのタイプを指定します。
上記の設定の場合、「文字列、ログ、テキスト」のデータをElasticsearchに格納する場合の例です。
数値系の「数値(整数)、数値(浮動小数)」データもElasticsearchに登録したい場合は、「uint,dbl」を追加します。
データの型毎に格納先をElasticsearchに変更できる仕様のようです。今のところ個々のアイテム毎に格納先を変更するとかはできないようです。
Zabbix Webの設定変更
Web管理画面からもElasticsearchのデータにアクセスする必要があるので変更します。
// global $DB;
global $DB, $HISTORY;
・・・略
$HISTORY['url']   = 'http://Elasticsearchのホスト名orIP:9200';
$HISTORY['types'] = ['str', 'text', 'log'];
Elasticsearchのマッピング定義
上記でZabbix側の設定は終了です。
あとは、Elasticsearch側で事前にマッピング定義を行います。
textというindexを作成してマッピング定義
itemidとclock、valueというフィールドを持つように定義します。
curl -X PUT http://Elasticsearchのホスト名orIP:9200/text -H 'content-type:application/json' -d '{
 "settings" : {
    "index" : {
       "number_of_replicas" : 1,
       "number_of_shards" : 5
    }
 },
 "mappings" : {
    "values" : {
       "properties" : {
          "itemid" : {
             "type" : "long"
          },
          "clock" : {
             "format" : "epoch_second",
             "type" : "date"
          },
          "value" : {
             "fields" : {
                "analyzed" : {
                   "index" : true,
                   "type" : "text",
                   "analyzer" : "standard"
                }
             },
             "index" : false,
             "type" : "text"
          }
       }
    }
 }
}'
同様にlog, str用の定義を行います。
analyzerの設定部分とか用途に応じて変更すれば色々と活用できるのではないでしょうか。とりあえずstandardのanalyzerで登録です。
curl -X PUT http://Elasticsearchのホスト名orIP:9200/log -H 'content-type:application/json' -d '
{
 "settings" : {
    "index" : {
       "number_of_replicas" : 1,
       "number_of_shards" : 5
    }
 },
 "mappings" : {
    "values" : {
       "properties" : {
          "itemid" : {
             "type" : "long"
          },
          "clock" : {
             "format" : "epoch_second",
             "type" : "date"
          },
          "value" : {
             "fields" : {
                "analyzed" : {
                   "index" : true,
                   "type" : "text",
                   "analyzer" : "standard"
                }
             },
             "index" : false,
             "type" : "text"
          }
       }
    }
 }
}'
curl -X PUT http://Elasticsearchのホスト名orIP:9200/str -H 'content-type:application/json' -d '
{
 "settings" : {
    "index" : {
       "number_of_replicas" : 1,
       "number_of_shards" : 5
    }
 },
 "mappings" : {
    "values" : {
       "properties" : {
          "itemid" : {
             "type" : "long"
          },
          "clock" : {
             "format" : "epoch_second",
             "type" : "date"
          },
          "value" : {
             "fields" : {
                "analyzed" : {
                   "index" : true,
                   "type" : "text",
                   "analyzer" : "standard"
                }
             },
             "index" : false,
             "type" : "text"
          }
       }
    }
 }
}'
Zabbix ServerおよびApacheの再起動
上記設定が完了後、Zabbix ServerおよびApacheを再起動します。
$ sudo systemctl restart zabbix-server.service
$ sudo systemctl restart httpd.service
これで基本の設定は完了です。
Zabbixのアイテムにログデータを登録
試しに、ログ型のアイテムを作って、zabbix_senderを使って登録してみます。
監視アイテムは以下の図のように作成します。
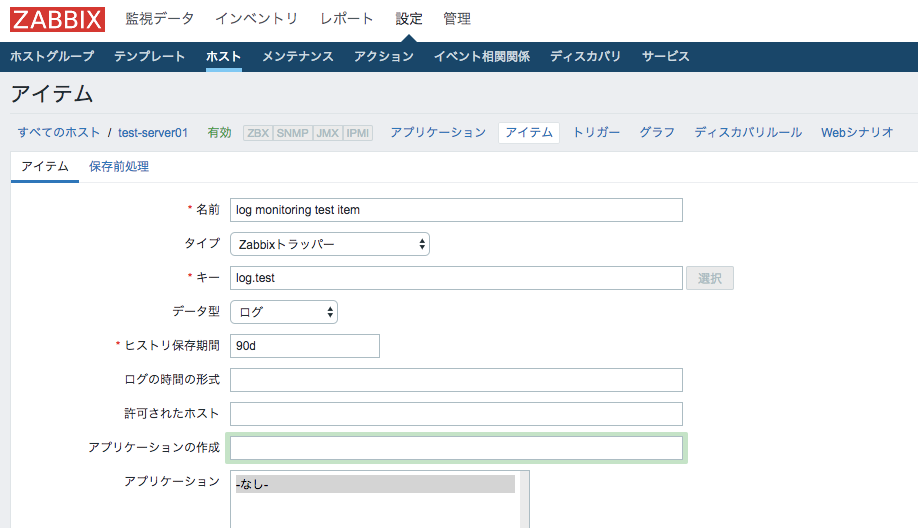
このアイテムに対して、以下のコマンドでデータを登録します。
$ zabbix_sender -z localhost -s test-server01 -k log.test -o 'This is log test'
info from server: "processed: 1; failed: 0; total: 1; seconds spent: 0.001055"
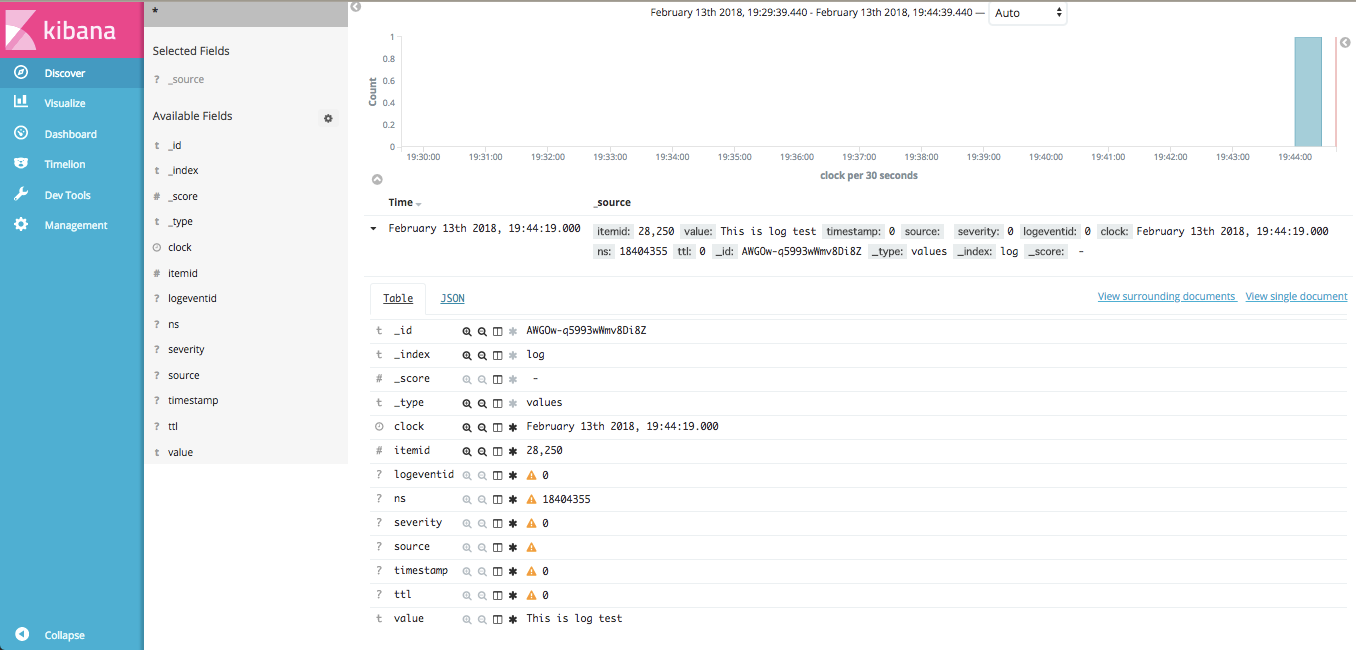
Elasticsearchに登録されたデータを確認
Kibanaが導入済みであればKibanaの画面上から確認します。
データはlogという名前のindex上に登録されていることがわかります。
念のため、ElasticsearchのAPIからデータを検索してみます。
curl -XGET 'http://Elasticsearchのホスト名orIP:9200/log/_search?q=*&pretty=true'
{
  "took" : 42,
  "timed_out" : false,
  "_shards" : {
    "total" : 5,
    "successful" : 5,
    "skipped" : 0,
    "failed" : 0
  },
  "hits" : {
    "total" : 1,
    "max_score" : 1.0,
    "hits" : [
      {
        "_index" : "log",
        "_type" : "values",
        "_id" : "AWGOw-q5993wWmv8Di8Z",
        "_score" : 1.0,
        "_source" : {
          "itemid" : 28250,
          "value" : "This is log test",
          "timestamp" : 0,
          "source" : "",
          "severity" : 0,
          "logeventid" : 0,
          "clock" : 1518518659,
          "ns" : 18404355,
          "ttl" : 0
        }
      }
    ]
  }
}
問題なく登録されています。
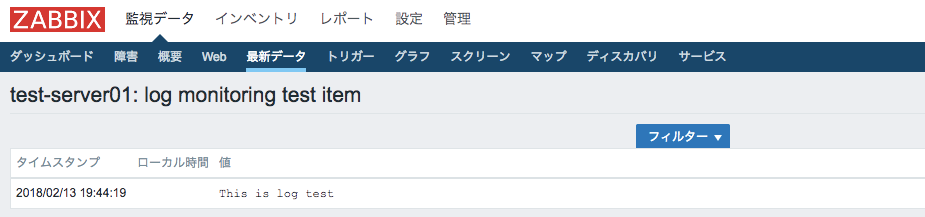
Zabbix上のデータ確認
次に、Zabbix側でどのように見えるか、およびRDBMS上どのようになっているか確認します。
Web管理画面から見ると、なんの問題もなく登録されています。
DBのデータは通常、ログ型のデータはhistory_logに保存されるのですが、以下の通り、0件となり、Elasticsearch上にのみ格納されていることがわかります。
MariaDB [zabbix]> select * from history_log;
Empty set (0.00 sec)
まとめ
簡単ではありますが、Zabbixの新機能のElasticsearch連携機能を紹介しました。
おそらく、この機能は今後Elasticsearchだけじゃなく、履歴データの格納先として様々変更できるようになっていくのではないかと思われます。(Elasticsearchに限った定義方法ではなく、HistoryStorageを設定するという感じのため)
単に監視するだけでなく、ログやテキストデータを分析するという部分もこれでかなりやすやすくなるのではないでしょうか。
Zabbix4.0ももうすぐリリースされそうなので、この機能が正式に長期サポート版(LTS版)で利用できる日も近いと思います。楽しみですねー