はじめに
手を動かして機械学習の勉強をしてみたいとおもって書いてみました.
python使った方が良さそうな気も(強く)したのですが,かねてよりgolangを使ってみたかったので,golangで実装してみました.行列計算のライブラリと,描画ライブラリを探してくるところからはじめます.
準備
機械学習の参考書など
golang
インストール
この辺を参考にしてインストールしておく.
ライブラリ
行列計算
行列計算のライブラリを使えるようにしておく.
どれを使えばよいかよく分からなかったので,とりあえず https://github.com/skelterjohn/go.matrix を利用してみました.
% go get github.com/skelterjohn/go.matrix
このとき,
error: error:0D0C50A1:asn1 encoding routines:ASN1_item_verify:unknown message digest algorithm while accessing
とかエラーが出たらopensslが古すぎるのが原因らしい.
package main

import (
	"fmt"
	matrix "github.com/skelterjohn/go.matrix"
)

func main() {
	s := `[1 2 3; 4 5 6; 7 8 9]` // MATLAB っぽく行列を構築できる
	m1, _ := matrix.ParseMatlab(s)
	fmt.Println(m1)

	m2 := matrix.MakeDenseMatrix([]float64{1, 2, 3, 4, 5, 6}, 2, 3) // 配列から行列に変換
	fmt.Println(m2)

	m3, _ := m1.Times(m2.Transpose()) // 転置行列
	fmt.Println(m3)

}
{1, 2, 3,
 4, 5, 6,
 7, 8, 9}
{1, 2, 3,
 4, 5, 6}
{ 14,  32,
  32,  77,
  50, 122}
グラフの描画
https://code.google.com/p/plotinum/ を利用しました.
インストールと使い方はこちら.
お題1: 線形回帰
http://gihyo.jp/dev/serial/01/machine-learning/0011?page=1&ard=1400930362
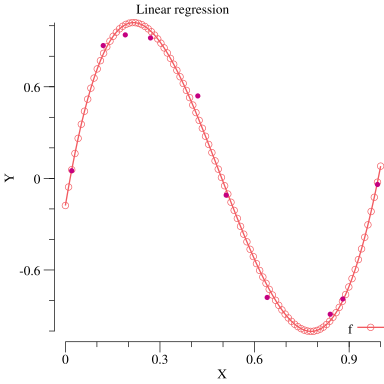
の記事を参考に線形回帰のプログラムを書いてみました.多項式関数を基底関数とした線形回帰です.
f(x) = w^T\Phi(x)
の重み$w$を求めます.基底関数$\Phi(x)$は4次の多項式関数と仮定しています.
重み$w$は解析的に求まります.
w = (\Phi^T\Phi)^{-1}{\Phi}t
プログラムでは,上記の$w$を計算して,求めた$w$でグラフを描いてみています.
/**
 * 線形回帰サンプル
 * 参考 : http://gihyo.jp/dev/serial/01/machine-learning/0011?page=1&ard=1400930362
 */

package main

import (
	"code.google.com/p/plotinum/plot"
	"code.google.com/p/plotinum/plotter"
	"code.google.com/p/plotinum/plotutil"
	"code.google.com/p/plotinum/vg"
	"github.com/skelterjohn/go.matrix"
	"image/color"
	"math"
)

func defaultBaseFunction(a_x float64) []float64 {
	return []float64{1, a_x, math.Pow(a_x, 2), math.Pow(a_x, 3)}
}

func makePhiMatrix(a_vec []float64, a_baseFunction func(float64) []float64) (matrix [][]float64) {
	matrix = make([][]float64, 0)
	for _, x := range a_vec {
		matrix = append(matrix, a_baseFunction(x))
	}
	return
}

func f(a_w []float64, a_x float64, a_baseFunction func(float64) []float64) float64 {
	vecW := matrix.MakeDenseMatrix(a_w, 1, len(a_w))
	phiX := a_baseFunction(a_x)
	vecPhiX := matrix.MakeDenseMatrix(phiX, len(phiX), 1)
	return matrix.Product(vecW, vecPhiX).Get(0, 0)
}

func linspace(a_start, a_end float64, a_n int) (ret []float64) {
	ret = make([]float64, a_n)
	if a_n == 1 {
		ret[0] = a_end
		return ret
	}
	delta := (a_end - a_start) / (float64(a_n) - 1)
	for i := 0; i < a_n; i++ {
		ret[i] = float64(a_start) + (delta * float64(i))
	}
	return
}

func addLine(a_p *plot.Plot, a_xVec, a_yVec []float64) {
	length := len(a_xVec)
	xys := make(plotter.XYs, length)
	for i := 0; i < length; i++ {
		xys[i].X = a_xVec[i]
		xys[i].Y = a_yVec[i]
	}
	plotutil.AddLinePoints(a_p, "f", xys)
}

func addPoints(a_p *plot.Plot, a_xVec, a_yVec []float64) {
	length := len(a_xVec)
	xyzs := make(plotter.XYZs, length)
	for i := 0; i < length; i++ {
		xyzs[i].X = a_xVec[i]
		xyzs[i].Y = a_yVec[i]
		xyzs[i].Z = 1
	}
	bs, _ := plotter.NewBubbles(xyzs, vg.Points(2), vg.Points(2))
	bs.Color = color.RGBA{R: 196, B: 128, A: 255}
	a_p.Add(bs)
}

func main() {
     	// alias
	Dot := matrix.Product
	Inv := matrix.Inverse
	T := matrix.Transpose

     	// train data
	vec_x := []float64{0.02, 0.12, 0.19, 0.27, 0.42, 0.51, 0.64, 0.84, 0.88, 0.99}
	vec_t := []float64{0.05, 0.87, 0.94, 0.92, 0.54, -0.11, -0.78, -0.89, -0.79, -0.04}

	// base function
	φ:= func(a_x float64) []float64 {
		return []float64{1, a_x, math.Pow(a_x, 2), math.Pow(a_x, 3), math.Pow(a_x, 4)}
	}
	// φ = defaultBaseFunction

	Φ := matrix.MakeDenseMatrixStacked(makePhiMatrix(vec_x, φ))
	w := Dot(Inv(Dot(T(Φ), Φ)), Dot(T(Φ), matrix.MakeDenseMatrix(vec_t, 10, 1)))

        // 求めた重みでグラフを描いてみる
	xlist := linspace(0, 1, 100)
	ylist := make([]float64, 0)
	for _, x := range xlist {
		ylist = append(ylist, f(w.Array(), x, φ))
	}

	// 描画
	p, _ := plot.New()
	p.Title.Text = "Linear regression"
	p.X.Label.Text = "X"
	p.Y.Label.Text = "Y"
	addLine(p, xlist, ylist)
	addPoints(p, vec_x, vec_t)
	p.Save(4, 4, "least_square_sample_01.png")
}
お題2: 最小二乗法
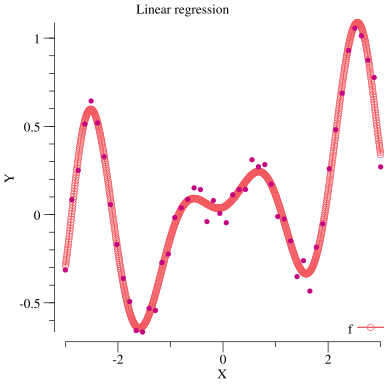
イラストで学ぶ機械学習の3章のMATLABのサンプルをgolangで書き下してみました.
直接 $w$ を求めるメソッドが行列計算のライブラリにはなかったので,お題1で使った方法で重み$w$を求めます.
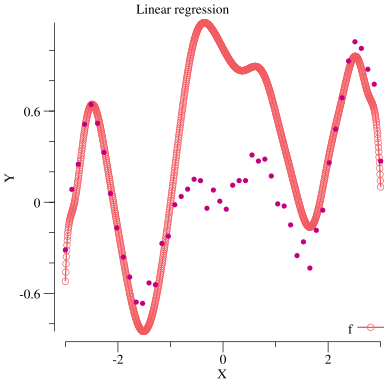
本には基底関数は $(1, \sin\frac{x}{2}, \cos\frac{x}{2}, ... ,\sin\frac{15x}{2}, \cos\frac{15x}{2})$ を利用するとあったのですが,これで学習してもうまくフィットしませんでした.過学習という感じのフィットではないので,もしかしたらどっか間違ってるのかもしれません.
/**
 * 最小二乗法サンプル
 * 参考 : イラストで学ぶ機械学習 Chapter3.1
 */

package main

import (
	"code.google.com/p/plotinum/plot"
	"code.google.com/p/plotinum/plotter"
	"code.google.com/p/plotinum/plotutil"
	"code.google.com/p/plotinum/vg"
	"github.com/skelterjohn/go.matrix"
	"image/color"
	"math"
	"math/rand"
//	"fmt"
)

func makeBaseFunction(a_m int) func(float64) []float64 {
	return func(a_x float64) []float64 {
		ret := make([]float64, 0, 2*a_m+1)
		for i := 0; i <= a_m; i++ {
			switch {
			case i == 0:
				ret = append(ret, 1)
			default:
				ret = append(ret, math.Sin(float64(i)*a_x/2), math.Cos(float64(i)*a_x/2))
			}
		}
		return ret
	}
}

func makePhiMatrix(a_vec []float64, a_baseFunction func(float64) []float64) (matrix [][]float64) {
	matrix = make([][]float64, 0)
	for _, x := range a_vec {
		matrix = append(matrix, a_baseFunction(x))
	}
	return
}

func f(a_w []float64, a_x float64, a_baseFunction func(float64) []float64) float64 {
	vecW := matrix.MakeDenseMatrix(a_w, 1, len(a_w))
	phiX := a_baseFunction(a_x)
	vecPhiX := matrix.MakeDenseMatrix(phiX, len(phiX), 1)
	return matrix.Product(vecW, vecPhiX).Get(0, 0)
}

func linspace(a_start, a_end float64, a_n int) (ret []float64) {
	ret = make([]float64, a_n)
	if a_n == 1 {
		ret[0] = a_end
		return ret
	}
	delta := (a_end - a_start) / (float64(a_n) - 1)
	for i := 0; i < a_n; i++ {
		ret[i] = float64(a_start) + (delta * float64(i))
	}
	return
}

func addLine(a_p *plot.Plot, a_xVec, a_yVec []float64) {
	length := len(a_xVec)
	xys := make(plotter.XYs, length)
	for i := 0; i < length; i++ {
		xys[i].X = a_xVec[i]
		xys[i].Y = a_yVec[i]
	}
	plotutil.AddLinePoints(a_p, "f", xys)
}

func addPoints(a_p *plot.Plot, a_xVec, a_yVec []float64) {
	length := len(a_xVec)
	xyzs := make(plotter.XYZs, length)
	for i := 0; i < length; i++ {
		xyzs[i].X = a_xVec[i]
		xyzs[i].Y = a_yVec[i]
		xyzs[i].Z = 1
	}
	bs, _ := plotter.NewBubbles(xyzs, vg.Points(2), vg.Points(2))
	bs.Color = color.RGBA{R: 196, B: 128, A: 255}
	a_p.Add(bs)
}

func main() {
	// alias
	Dot := matrix.Product
	Inv := matrix.Inverse
	T := matrix.Transpose
	Sin := math.Sin
	Pi := math.Pi

	// rand
	r := rand.New(rand.NewSource(0))

	// train data
	train_data_size := 50
	vec_x := linspace(-3, 3, train_data_size)
	vec_t := make([]float64, 0, train_data_size)
	for _, x := range vec_x {
		vec_t = append(vec_t, Sin(Pi*x)/Pi*x+0.1*x+0.05*r.NormFloat64())
	}

	// base function
	φ := makeBaseFunction(5) // ここ,例は 15 だけど,15 にすると上手くフィットしない

	// estimate
	Φ := matrix.MakeDenseMatrixStacked(makePhiMatrix(vec_x, φ))
	w := Dot(Inv(Dot(T(Φ), Φ)), Dot(T(Φ), matrix.MakeDenseMatrix(vec_t, len(vec_t), 1)))

	// 求めた重みでグラフを描いてみる
	xlist := linspace(-3, 3, 1000)
	ylist := make([]float64, 0, 1000)
	for _, x := range xlist {
		ylist = append(ylist, f(w.Array(), x, φ))
	}

	// 描画
	p, _ := plot.New()
	p.Title.Text = "Linear regression"
	p.X.Label.Text = "X"
	p.Y.Label.Text = "Y"
	addLine(p, xlist, ylist)
	addPoints(p, vec_x, vec_t)
	p.Save(4, 4, "least_square_sample_01.png")
}


