はじめに
最近Kibana をいじってますが、Vega が面白そうだったので、学習しつつまとめていこうかなと思います。
動作確認環境
- Kibana: 6.7.1
- ElasticSearch: 6.7.1
- Vega: 3.3.1
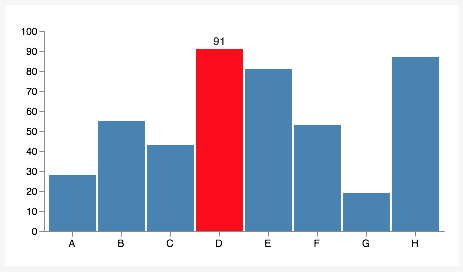
棒グラフ
Example の一番最初にでてくるシンプルなやつです。
マウスオーバーすると赤くなり、値が上に表示されます。
Example の Json
{
  "$schema": "https://vega.github.io/schema/vega/v3.3.1.json",
  "width": 400,
  "height": 200,
  "padding": 5,

  "data": [
    {
      "name": "table",
      "values": [
        {"category": "A", "amount": 28},
        {"category": "B", "amount": 55},
        {"category": "C", "amount": 43},
        {"category": "D", "amount": 91},
        {"category": "E", "amount": 81},
        {"category": "F", "amount": 53},
        {"category": "G", "amount": 19},
        {"category": "H", "amount": 87}
      ]
    }
  ],

  "signals": [
    {
      "name": "tooltip",
      "value": {},
      "on": [
        {"events": "rect:mouseover", "update": "datum"},
        {"events": "rect:mouseout",  "update": "{}"}
      ]
    }
  ],

  "scales": [
    {
      "name": "xscale",
      "type": "band",
      "domain": {"data": "table", "field": "category"},
      "range": "width",
      "padding": 0.05,
      "round": true
    },
    {
      "name": "yscale",
      "domain": {"data": "table", "field": "amount"},
      "nice": true,
      "range": "height"
    }
  ],

  "axes": [
    { "orient": "bottom", "scale": "xscale" },
    { "orient": "left", "scale": "yscale" }
  ],

  "marks": [
    {
      "type": "rect",
      "from": {"data":"table"},
      "encode": {
        "enter": {
          "x": {"scale": "xscale", "field": "category"},
          "width": {"scale": "xscale", "band": 1},
          "y": {"scale": "yscale", "field": "amount"},
          "y2": {"scale": "yscale", "value": 0}
        },
        "update": {
          "fill": {"value": "steelblue"}
        },
        "hover": {
          "fill": {"value": "red"}
        }
      }
    },
    {
      "type": "text",
      "encode": {
        "enter": {
          "align": {"value": "center"},
          "baseline": {"value": "bottom"},
          "fill": {"value": "#333"}
        },
        "update": {
          "x": {"scale": "xscale", "signal": "tooltip.category", "band": 0.5},
          "y": {"scale": "yscale", "signal": "tooltip.amount", "offset": -2},
          "text": {"signal": "tooltip.amount"},
          "fillOpacity": [
            {"test": "isNaN(tooltip.amount)", "value": 0},
            {"value": 1}
          ]
        }
      }
    }
  ]
}
Elasticsearch からデータを取得するように修正
まず、データをElasticsearch に登録。
以下をKibana のDev Toolsコンソールで実行。
POST /test_vega_bar1/barchart/_bulk
{ "index" : {}}
{"category": "A", "amount": 28}
{ "index" : {}}
{"category": "B", "amount": 55}
{ "index" : {}}
{"category": "C", "amount": 43}
{ "index" : {}}
{"category": "D", "amount": 91}
{ "index" : {}}
{"category": "E", "amount": 81}
{ "index" : {}}
{"category": "F", "amount": 53}
{ "index" : {}}
{"category": "G", "amount": 19}
{ "index" : {}}
{"category": "H", "amount": 87}
category でsortできるように以下も実行。
PUT /test_vega_bar1/_mapping/_doc
{
  "properties": {
    "category": {
      "type": "text",
      "fielddata": true
    }
  }
}
data.values を data.url に変更し、queryの情報を記載。
なお、url.index などの一部プロパティは、Kibanaでoverride されたものであり、Vegaのドキュメントには記載がないので注意が必要です。
ElasticSearchのレスポンスの構造※を処理するために、その他ちょこちょこ修正します。
レスポンスデータは、ブラウザの開発者ツールのNetworkタブで確認できます。
※レスポンスデータ
{
  "took" : 4,
  "timed_out" : false,
  "_shards" : {
    "total" : 5,
    "successful" : 5,
    "skipped" : 0,
    "failed" : 0
  },
  "hits" : {
    "total" : 8,
    "max_score" : null,
    "hits" : [
      {
        "_index" : "test_vega_bar1",
        "_type" : "barchart",
        "_id" : "OwJtaWoBbqQmzNq-v7wS",
        "_score" : null,
        "_source" : {
          "category" : "A",
          "amount" : 28
        },
        "sort" : [
          "a"
        ]
      },
      {
        "_index" : "test_vega_bar1",
        "_type" : "barchart",
        "_id" : "PAJtaWoBbqQmzNq-v7wS",
        "_score" : null,
        "_source" : {
          "category" : "B",
          "amount" : 55
        },
        "sort" : [
          "b"
        ]
      },
      {
        "_index" : "test_vega_bar1",
        "_type" : "barchart",
        "_id" : "PQJtaWoBbqQmzNq-v7wS",
        "_score" : null,
        "_source" : {
          "category" : "C",
          "amount" : 43
        },
        "sort" : [
          "c"
        ]
      },
      {
        "_index" : "test_vega_bar1",
        "_type" : "barchart",
        "_id" : "PgJtaWoBbqQmzNq-v7wS",
        "_score" : null,
        "_source" : {
          "category" : "D",
          "amount" : 91
        },
        "sort" : [
          "d"
        ]
      },
      {
        "_index" : "test_vega_bar1",
        "_type" : "barchart",
        "_id" : "PwJtaWoBbqQmzNq-v7wS",
        "_score" : null,
        "_source" : {
          "category" : "E",
          "amount" : 81
        },
        "sort" : [
          "e"
        ]
      },
      {
        "_index" : "test_vega_bar1",
        "_type" : "barchart",
        "_id" : "QAJtaWoBbqQmzNq-v7wS",
        "_score" : null,
        "_source" : {
          "category" : "F",
          "amount" : 53
        },
        "sort" : [
          "f"
        ]
      },
      {
        "_index" : "test_vega_bar1",
        "_type" : "barchart",
        "_id" : "QQJtaWoBbqQmzNq-v7wS",
        "_score" : null,
        "_source" : {
          "category" : "G",
          "amount" : 19
        },
        "sort" : [
          "g"
        ]
      },
      {
        "_index" : "test_vega_bar1",
        "_type" : "barchart",
        "_id" : "QgJtaWoBbqQmzNq-v7wS",
        "_score" : null,
        "_source" : {
          "category" : "H",
          "amount" : 87
        },
        "sort" : [
          "h"
        ]
      }
    ]
  }
}
{
  $schema: https://vega.github.io/schema/vega/v3.3.1.json
  width: 400
  height: 200
  padding: 5
  data: {
    name: table
    url: {                              // values から urlに変更し、indexを指定
      index: test_vega_bar1
      body: {
        "sort" : {"category": "asc"}
      }
    }
    format: {property: "hits.hits"}     // POST /test_vega_bar1/_search のレスポンスをformatして、データ配列を取得(結果は、Dev Toolsで確認可能)
  }
  signals: [
    {
      name: tooltip
      value: {}
      on: [
        {events: "rect:mouseover", update: "datum._source"} // _sourceから取得
        {events: "rect:mouseout", update: "{}"}
      ]
    }
  ]
  scales: [
    {
      name: xscale
      type: band
      domain: {data: "table", field: "_source.category"}    // _sourceから取得
      range: width
      padding: 0.05
      round: true
    }
    {
      name: yscale
      domain: {data: "table", field: "_source.amount"}      // _sourceから取得
      nice: true
      range: height
    }
  ]
  axes: [
    {orient: "bottom", scale: "xscale"}
    {orient: "left", scale: "yscale"}
  ]
  marks: [
    {
      type: rect
      from: {data: "table"}
      encode: {
        enter: {
          x: {scale: "xscale", field: "_source.category"}   // _sourceから取得
          width: {scale: "xscale", band: 1}
          y: {scale: "yscale", field: "_source.amount"}     // _sourceから取得
          y2: {scale: "yscale", value: 0}
        }
        update: {
          fill: {value: "steelblue"}
        }
        hover: {
          fill: {value: "red"}
        }
      }
    }
    {
      type: text
      encode: {
        enter: {
          align: {value: "center"}
          baseline: {value: "bottom"}
          fill: {value: "#333"}
        }
        update: {
          x: {scale: "xscale", signal: "tooltip.category", band: 0.5}
          y: {scale: "yscale", signal: "tooltip.amount", offset: -2}
          text: {signal: "tooltip.amount"}
          fillOpacity: [
            {test: "isNaN(tooltip.amount)", value: 0}
            {value: 1}
          ]
        }
      }
    }
  ]
}
メモ
- signals: 動的変数。
tooltipは、type:rectに対してイベントを登録しており棒グラフにマウスオーバーすると値が変更。marksの2つ目(type=text)がsignal.tooltipを利用しており、棒グラフの上にamount が表示されている。 - eventsの
rect:mouseoverは、type以外にもnameで指定することもでき、その場合は、@xxx:mouseoverのように書ける。 - fiillOpacity: tooltip.amount がNan だったら、不透明度を0にして透明に。
線グラフ
次は、線グラフ
棒グラフと同じように ElasticSearch にデータ挿入
以下をKibana のDev Toolsコンソールで実行。
POST /test_vega_line1/linechart/_bulk
{"index": {}}
{"x": 0, "y": 28, "c":0}
{"index": {}}
{"x": 0, "y": 20, "c":1}
{"index": {}}
{"x": 1, "y": 43, "c":0}
{"index": {}}
{"x": 1, "y": 35, "c":1}
{"index": {}}
{"x": 2, "y": 81, "c":0}
{"index": {}}
{"x": 2, "y": 10, "c":1}
{"index": {}}
{"x": 3, "y": 19, "c":0}
{"index": {}}
{"x": 3, "y": 15, "c":1}
{"index": {}}
{"x": 4, "y": 52, "c":0}
{"index": {}}
{"x": 4, "y": 48, "c":1}
{"index": {}}
{"x": 5, "y": 24, "c":0}
{"index": {}}
{"x": 5, "y": 28, "c":1}
{"index": {}}
{"x": 6, "y": 87, "c":0}
{"index": {}}
{"x": 6, "y": 66, "c":1}
{"index": {}}
{"x": 7, "y": 17, "c":0}
{"index": {}}
{"x": 7, "y": 27, "c":1}
{"index": {}}
{"x": 8, "y": 68, "c":0}
{"index": {}}
{"x": 8, "y": 16, "c":1}
{"index": {}}
{"x": 9, "y": 49, "c":0}
{"index": {}}
{"x": 9, "y": 25, "c":1}
棒グラフと同じように data を修正
{
  $schema: https://vega.github.io/schema/vega/v3.3.1.json

  padding: 5
  signals: [
    {
      name: interpolate
      value: linear
      bind: {
        input: select
        options: [
          basis
          cardinal
          catmull-rom
          linear
          monotone
          natural
          step
          step-after
          step-before
        ]
      }
    }
  ]
  data: [
    {
      name: table
      url: {                    // 棒グラフと同じように修正
        index: test_vega_line1
        body: {
          sort: { x: "asc"}
          size: 100
        }
      }
      format: {property: "hits.hits"}
    }
  ]
  scales: [
    {
      name: x
      type: point
      range: width
      domain: {data: "table", field: "_source.x"} // 修正
    }
    {
      name: y
      type: linear
      range: height
      nice: true
      zero: true
      domain: {data: "table", field: "_source.y"} // 修正
    }
    {
      name: color
      type: ordinal
      range: category
      domain: {data: "table", field: "_source.c"} // 修正
    }
  ]
  axes: [
    {orient: "bottom", scale: "x"}
    {orient: "left", scale: "y"}
  ]
  marks: [
    {
      type: group
      from: {
        facet: {name: "series", data: "table", groupby: "_source.c"}        // 修正
      }
      marks: [
        {
          type: line
          from: {data: "series"}
          encode: {
            enter: {
              x: {scale: "x", field: "_source.x"}           // 修正
              y: {scale: "y", field: "_source.y"}           // 修正
              stroke: {scale: "color", field: "_source.c"}  // 修正
              strokeWidth: {value: 2}
            }
            update: {
              interpolate: {signal: "interpolate"}
              fillOpacity: {value: 1}
            }
            hover: {
              fillOpacity: {value: 0.5}
            }
          }
        }
      ]
    }
  ]
}
メモ
- signals: input 要素にbindできる。select の他に、checkbox, radioなどHTMLのinput typeを指定可能
- marks: c要素でグルーピング後したデータセットを入れ子にしたmarksに渡し、線グラフをそれぞれ描画
まとめ
とりあえず、Vega のExampleを参考にし、Elasticseachからデータを取得し描画しました。
次回は、他のExampleを試してみようと思います。