今回は、時系列のデータからグラフを描画します。(前回はここ)
以下のような簡単なデータから始めます。
[
  {"month": "2019-04", "amount": 28},
  {"month": "2019-05", "amount": 55},
  {"month": "2019-09", "amount": 10}
]
データの型決め
まずは、month要素が、文字列でなく時間型であることを教える必要があります。
ここでは、formatプロパティを利用し、month要素をdate型でparseするとします。
  "data": [
    {
      "name": "table",
      "format": {"type": "json", "parse": {"month": "date"}},
      "values": [
        {"month": "2019-04", "amount": 28},
        {"month": "2019-05", "amount": 55},
        {"month": "2019-09", "amount": 10}
      ]
    }
  ],
scale, 図の設定
前回までは、type にband を指定していましたが、time を指定します。
  "scales": [
    {
      "name": "xscale",
      "type": "time",
      "domain": {"data": "table", "field": "month"},
      "range": "width",
      "round": true
    },
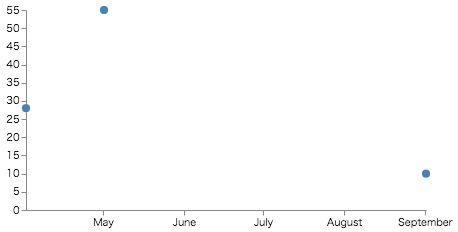
一旦、marksのtypeをrect でなく、symbol にし、散布図のように表示してみます。
  "marks": [
    {
      "name": "layer_0",
      "type": "symbol",
      "from": {"data":"table"},
      "encode": {
        "enter": {
          "x": {"scale": "xscale", "field": "date"},
          "y": {"scale": "yscale", "field": "amount"},
          "fill": {"value": "steelblue"}
        }
      }
    }
  ]
こんな感じになります。
日付ごとのデータであればこのグラフでもいいですが、今回は月ごとのデータで表示領域も狭いので、棒グラフへと変更していきたいと思います。
散布図から棒グラフへの変更
棒グラフにするために、marks のtypeをrectにします。前回までは、棒の幅(width)として、{"scale":"xscale", "band":1}を指定して表現していました。
しかし、今回xscaleはtimeであるためbandがありません。そこで、widthの代わりにx2を利用し、x2に翌月の位置を指定することで棒グラフを作成します。4月の場合、4月頭から5月までといった形です。
Vegaには、データに対して様々な加工が可能になっています。これを利用し各データの翌月の値を求めます。
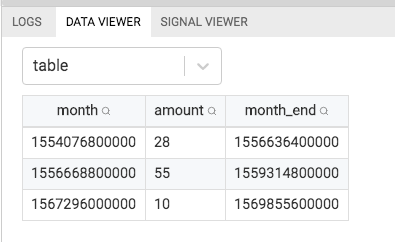
データを拡張するformulaを使います。各行データ(datum)から、年と月を取得した上で、1ヶ月足した値をmonth_endとし、各行に追加します。
※ 5.8 以上から別の書き方ができます。
  "data": [
    {
      "name": "table",
      "format": {"type": "json", "parse": {"month": "date"}},
      "values": [
        {"month": "2019-04", "amount": 28},
        {"month": "2019-05", "amount": 55},
        {"month": "2019-09", "amount": 10}
      ],
      "transform": [
        {
          "type":"formula",
          "as": "month_end",
          "expr": "time(datetime(year(datum.month), month(datum.month)+1))"
        }
      ]
    }
  ],
こんな感じにデータが追加されます。
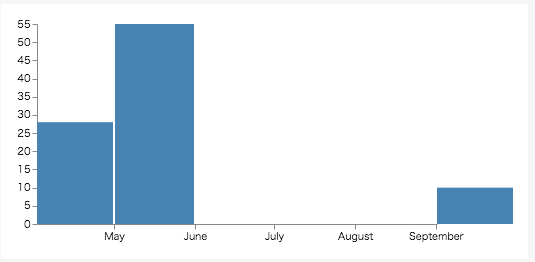
このデータを使って描画します。x2に先ほど作成したmonth_endを指定します。このままでは、棒グラフが接してしまうため、offset:-1を指定し、終了位置を少しずらします。
"marks": [
    {
      "name": "layer_0",
      "type": "rect",
      "from": {"data":"table"},
      "encode": {
        "enter": {
          "x": {"scale": "xscale", "field": "month"},
          "x2": {"scale": "xscale", "field": "month_end", "offset":-1},
          "y": {"scale": "yscale", "field": "amount"},
          "y2": {"scale": "yscale", "value": 0},
          "fill": {"value": "steelblue"}
        }
      }
    }
  ]
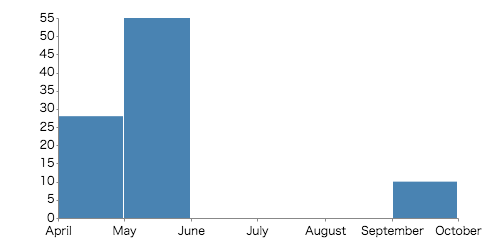
x軸の始まりと終わりが中途半端になっているので、xscale に"nice":"month" を指定します。
niceは、いい感じに軸を拡張してくれます。 4/10~9/15までのデータの場合、monthを指定すると、4月頭から9月末までがグラフ内に収まるようになり、yearを指定すると、1月頭から12月末までがグラフ内に収まるようになります。
これを設定することで、最初の完成形になります。
散布図から棒グラフへの変更(>=5.8) 追記
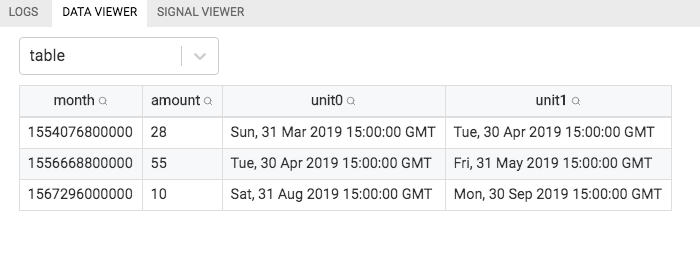
5.8から、transformにtimeunit が追加されていました。これを利用することで、範囲の取得を簡単にできるようになりました。
"data": [
    {
      "name": "table",
      "format": {"type": "json", "parse": {"month": "date"}},
      "values": [
        {"month": "2019-04", "amount": 28},
        {"month": "2019-05", "amount": 55},
        {"month": "2019-09", "amount": 10}
      ],
      "transform": [
        {
          "type":"timeunit",
          "field":"month",
          "units": ["year", "month"]
        }
      ]
    }
  ],
こんなデータに変換されます。
units で指定された、年月に従い、月初から月末の値が、unit0,1に入ります。
["month"] のみを指定すると、年の情報は無視された値がはいります。複数年にわたるデータで、月ごとの特性をみたいときに使います。
他にquarter も指定できます。
https://vega.github.io/vega/docs/transforms/timeunit/#time-units
次回は、何か実際のデータを活用しながら、グラフを書いていこうかなと考えています(未定)
