4
6

Delete article

Deleted articles cannot be recovered.

Draft of this article would be also deleted.

Are you sure you want to delete this article?

More than 5 years have passed since last update.

pythonでグラフ作成(メモ)

Posted at

SymPyでグラフを描く

 pythonでグラフを作成・可視化するために一般的なライブラリにMatplotlib(マットプロットリブ)があります。NumPyで数学の関数を作成する場合は、関数を作成し列データを作成してMatplotlibにプロットします。一方でSymPyを使用する場合は関数を数式としてプロットすることができます。

NumPyでのプロット

 NumPyとSymPyを使用して三角関数をプロットします。はじめにNumPyでプロットします。

%matplotlib inline
import numpy as np
import matplotlib.pyplot as plt

x = np.linspace(0, 10, 100)
y  = np.sin(x)
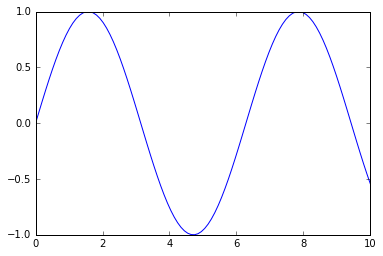
plt.plot(x, y)

output_4_1.png

SymPyでのプロット

 つづいてSymPyでのプロットを行います。SymPy Module Referenceを参考にします。http://docs.sympy.org/latest/modules/plotting.html

%matplotlib inline
from sympy import Symbol
from sympy import sin
from sympy.plotting import plot

x = Symbol('x')

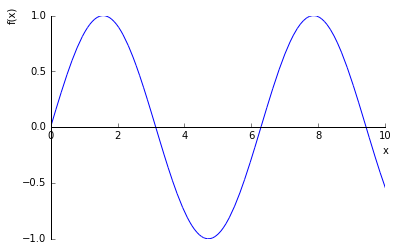
plot(sin(x),(x,0,10))

output_7_0.png

SymPyではMatplotlibがバックグラウンドで動作しています。

参考サイト
4
6
0

Register as a new user and use Qiita more conveniently

  1. You get articles that match your needs
  2. You can efficiently read back useful information
  3. You can use dark theme
What you can do with signing up
4
6

Delete article

Deleted articles cannot be recovered.

Draft of this article would be also deleted.

Are you sure you want to delete this article?