初めに
大学のゼミで感染症の流行モデルであるSIRモデルについて調べたので、記事として残しておく。
コードは https://github.com/icy-mountain/SIR_plot に置いてある。
実行環境
windows10
Rstudio
R 4.0.1
本題
ライブラリの読み込み
SIR_plot.R
library(deSolve)
library(ggplot2)
微分方程式を表すためにdeSolve,可視化のためにggplotライブラリを読み込む。
微分方程式や初期値の定義
SIR_plot.R
parameters <- c(b = 1/2, g = 1/3)# パラメータのセット
initial <- c(s = 1, i = 1.27*10^(-6), r = 0)# 初期条件
times <- seq(1, 180, 1)# 差分刻み

SIR <- function(t, state, parameters) {
  with(as.list(c(state, parameters)), {
    ds <- -b * s * i
    di <- (b * s - g)*i
    dr <- g * i
    list(c(ds, di, dr))
  })
}
out <- ode(y = initial, times = times, func = SIR, parms = parameters)
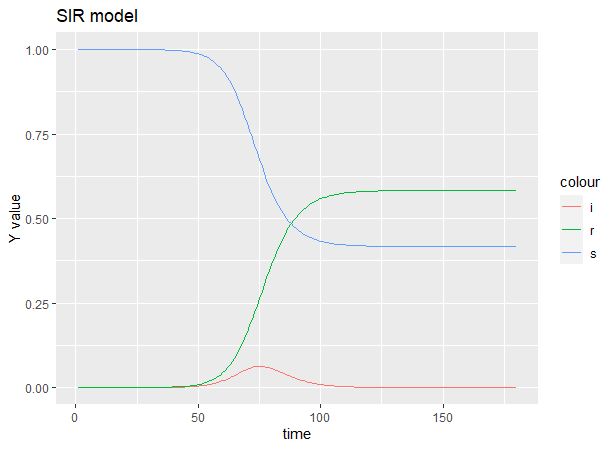
1960年代のNYで起こった香港風邪のシミュレーションを行う。各パラメータや初期値はこのサイトを参考にした。
可視化のために微分方程式の結果をoutに代入しておく。
ggplotで可視化
SIR_plot.R
out_df <- as.data.frame(out)
SIRplot_base <- ggplot(data=out_df) +
  xlab("time")+ ylab("Y value") +
  ggtitle("SIR model")

SIRplot <- SIRplot_base +
  layer(
    mapping=aes(x=time, y=s, colour="s"),
    geom="line",
    stat="identity",
    position="identity",
  ) +
  layer(
    mapping=aes(x=time, y=i, colour="i"),
    geom="line",
    stat="identity",
    position="identity",
  ) +
  layer(
    mapping=aes(x=time, y=r,colour="r"),
    geom="line",
    stat="identity",
    position="identity",
  )
微分方程式の結果をdata.frameに変換して、S,I,Rの値をプロットする。
結果
おわり