データラベルによって、データ系列またはその個々のデータポイントに関する詳細情報が表示されるので、グラフが理解しやすくなります。今回はSpire.Presentation for Javaを使ってPowerPointでグラフにデータラベルを追加する方法を説明します。
下準備
1.E-iceblueの公式サイトからFree Spire. Presentation for Java無料版をダウンロードしてください。

2. IDEを起動して新規プロジェクトを作成してから、インストールされたファイルにあった相応しいSpire. Presentation.jarを参照に追加してください。
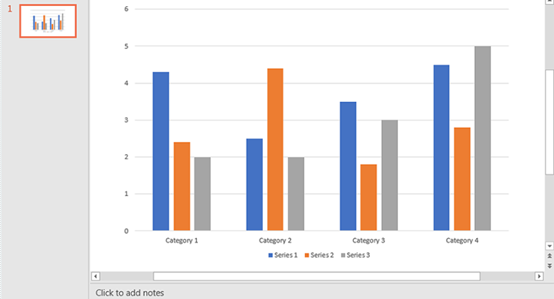
元のファイル
```JAVA import com.spire.presentation.FileFormat; import com.spire.presentation.ISlide; import com.spire.presentation.Presentation; import com.spire.presentation.charts.IChart; import com.spire.presentation.charts.entity.ChartDataLabel; import com.spire.presentation.charts.entity.ChartSeriesDataFormat; import com.spire.presentation.drawing.FillFormatType;
import java.awt.*;
public class AddDataLabelsToChart {
public static void main(String[] args) throws Exception {
//PowerPointをロードします。
Presentation ppt = new Presentation();
ppt.loadFromFile("Chart.pptx");
    //スライドを取得します。
    ISlide slide = ppt.getSlides().get(0);
    //チャートを取得します。
    IChart chart = (IChart)slide.getShapes().get(0);

    //グラフの系列を取得します。
    for (ChartSeriesDataFormat series:(Iterable)chart.getSeries()
         ) {
        //各系列にデータラベルをつけます。
        for(int i = 0; i < 4; i++){
            ChartDataLabel dataLabel = series.getDataLabels().add();
            //ラベルの値を表示します。
            dataLabel.setLabelValueVisible(true);
            //ラベルの系列を表示します。
            dataLabel.setSeriesNameVisible(true);
            //ラベルの枠を設定します。
            dataLabel.getLine().setFillType(FillFormatType.SOLID);
            dataLabel.getLine().getSolidFillColor().setColor(Color.RED);
            //ラベルの塗りつぶしを設定します。
            dataLabel.getFill().setFillType(FillFormatType.SOLID);
            dataLabel.getFill().getSolidColor().setColor(Color.YELLOW);
        }
    }

    //保存します。
    ppt.saveToFile("DataLabels.pptx", FileFormat.PPTX_2013);
}
}
<h4><strong>実行結果</strong></h4>
<p><img src="https://cdn-ak.f.st-hatena.com/images/fotolife/l/lendoris/20210317/20210317121158.png" alt="f:id:lendoris:20210317121158p:plain" title="" class="hatena-fotolife" itemprop="image" /></p>
<p> </p>

