はじめに
この記事では、インタラクティブなグラフを簡単に描画できるOSSのライブラリ **plotly.js**について取り扱います。本記事の内容はJavaScriptについてですが、PlotlyはPython、R、MATLAB、Juliaなどでも利用することが出来ます。
 > https://plot.ly/
Plotlyの強み
Plotly以外にもOSSで完成度の高い可視化ライブラリは多数あります。
- Highchart
- Charts.js
- Recharts (for react)
- c3.js
- etc...
Plotlyのメリットは個人的にこのあたりかと思っています。
- 図を直接変更可能
- 細かい設定項目
- 画像エクスポート
他のライブラリでも軸のスケールをカーソル操作で変更できたりするようなものはあります。Plotlyはそれ加え、アノテーションの編集や移動など、より高度なインタラクティブ性を提供しています。
 > [[Python] Plotlyでぐりぐり動かせるグラフを作る](https://qiita.com/inoory/items/12028af62018bf367722)
また、可視化ライブラリでありがちなのが、レイアウトの設定項目がなくて目的の形式でグラフが作れないこと。結局、d3.jsなどで1から作ることになったりすることもしばしば。その点、Plotlyでは比較的多くの設定項目が存在します。
画像のエクスポート機能があるのも魅力です。jpeg, png, svg, pdfをサポートしています。他のライブラリで生成されたSVGをそのままファイルとして保存すると、スタイルが各svg要素に埋め込まれていないため、スタイルが崩れてしまいます。個人的には嬉しいポイントです。
Get Started
使い方は非常に簡単。
- jsファイルを読み込み
- dataオブジェクトを用意 (必要に応じてlayout, configオブジェクトも)
- plot関数で描画
<head>
  <!-- Plotly.js -->
  <script src="https://cdn.plot.ly/plotly-latest.min.js"></script>
</head>

<body>
  <div id="myDiv"><!-- Plotly chart will be drawn inside this DIV --></div>
  <script>
    var trace1 = {
      x: [1, 2, 3, 4],
      y: [10, 15, 13, 17],
      type: 'scatter'
    };

    var trace2 = {
      x: [1, 2, 3, 4],
      y: [16, 5, 11, 9],
      type: 'scatter'
    };

    var data = [trace1, trace2];

    Plotly.newPlot('myDiv', data);
  </script>
</body>
See the Pen Basic Line Plot with Plotly.js Charts by plotly (@plotly) on CodePen.
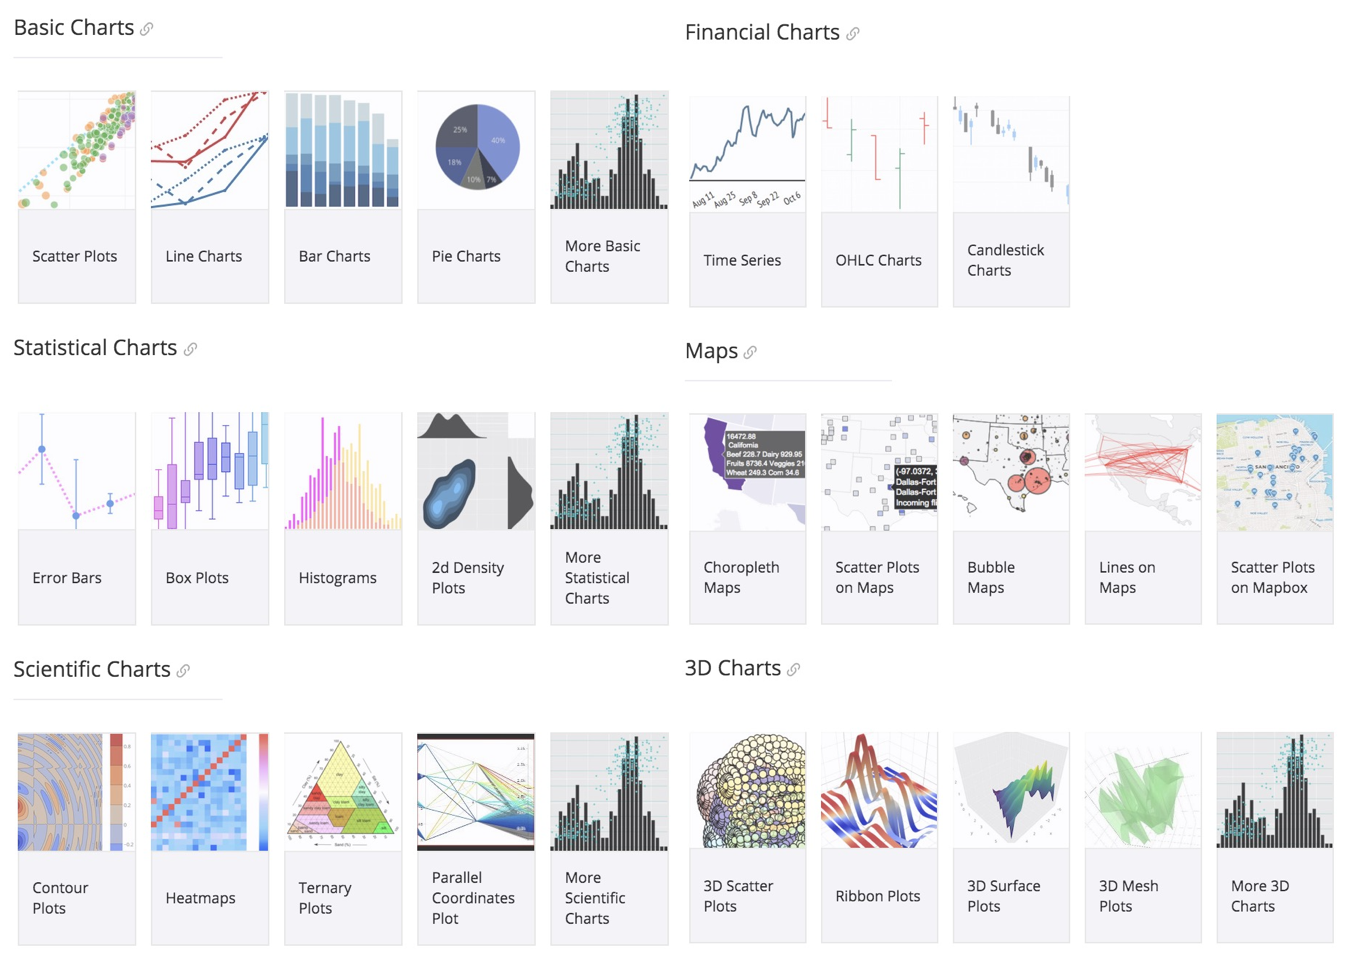
グラフの種類
基本的なものから、金融、統計、3Dなど多数用意されています。
グラフの設定
目的のグラフを描画するために編集するオブジェクトはdata、layout、configの3つです。1つ目は可視化するデータやその種類に関して、2つ目はサイズや軸、注釈などレイアウトに関して(そのままですが)、3つ目は描画されたグラフのズームや編集機能のON/OFFなど動作設定についてを記述します。
Data
各グラフ毎のデータ形式は公式のリファレンスに載っています。
https://plot.ly/javascript/#basic-charts
Layout
Plotlyには非常に細かくレイアウトの設定項目が用意されています。公式のリファレンスはこちら。
簡易的なレイアウト変更サンプル
https://plot.ly/javascript/#layout-options
完全版
https://plot.ly/javascript/reference/
完全版は量が多いので全て読むのは大変ですが、駆使すれば軸のメモリ長や方向などかなり細かいところも変更できます。個人的にはグラフの要素と描画エリア端のマージンが自動で計算されなのが惜しいと感じます。
Config
configに関するリファレンスはこちら
https://plot.ly/javascript/configuration-options/
ただし、なぜか設定できる項目の一部しか記載されていません。
GitHubのコードを見ると、より多くの設定項目が用意されていることが確認できます。
https://github.com/plotly/plotly.js/blob/master/src/plot_api/plot_config.js
よく使いそうなものを一部抜粋
editable: false,
edits: {
    /*
     * annotationPosition: the main anchor of the annotation, which is the
     * text (if no arrow) or the arrow (which drags the whole thing leaving
     * the arrow length & direction unchanged)
     */
annotationPosition: false,
    // just for annotations with arrows, change the length  and direction of the arrow
    annotationTail: false,
    annotationText: false,
    axisTitleText: false,
    colorbarPosition: false,
    colorbarTitleText: false,
    legendPosition: false,
    // edit the trace name fields from the legend
    legendText: false,
    shapePosition: false,
    // the global `layout.title`
    titleText: false
},

/*
 * DO autosize once regardless of layout.autosize
 * (use default width or height values otherwise)
 */
autosizable: false,

// mousewheel or two-finger scroll zooms the plot
scrollZoom: false,

/*
 * enable direct range entry at the pan/zoom drag points
 * (drag handles must be enabled above)
 */
showAxisRangeEntryBoxes: true,

// text appearing in the sendData link
linkText: 'Edit chart',

// display the mode bar (true, false, or 'hover')
displayModeBar: 'hover',

/*
 * remove mode bar button by name
 * (see ./components/modebar/buttons.js for the list of names)
 */
modeBarButtonsToRemove: [],

/*
 * add mode bar button using config objects
 * (see ./components/modebar/buttons.js for list of arguments)
 */
modeBarButtonsToAdd: [],

/*
 * fully custom mode bar buttons as nested array,
 * where the outer arrays represents button groups, and
 * the inner arrays have buttons config objects or names of default buttons
 * (see ./components/modebar/buttons.js for more info)
 */
modeBarButtons: false,

// add the plotly logo on the end of the mode bar
displaylogo: true,

setBackground: 'transparent',

/*
 * Which localization should we use?
 * Should be a string like 'en' or 'en-US'.
 */
locale: 'en-US',

/*
 * Localization definitions
 * Locales can be provided either here (specific to one chart) or globally
 * by registering them as modules.
 * Should be an object of objects {locale: {dictionary: {...}, format: {...}}}
 * {
 *     da: {
 *         dictionary: {'Reset axes': 'Nulstil aksler', ...},
 *         format: {months: [...], shortMonths: [...]}
 *     },
 *     ...
 * }
 * All parts are optional. When looking for translation or format fields, we
 * look first for an exact match in a config locale, then in a registered
 * module. If those fail, we strip off any regionalization ('en-US' -> 'en')
 * and try each (config, registry) again. The final fallback for translation
 * is untranslated (which is US English) and for formats is the base English
 * (the only consequence being the last fallback date format %x is DD/MM/YYYY
 * instead of MM/DD/YYYY). Currently `grouping` and `currency` are ignored
 * for our automatic number formatting, but can be used in custom formats.
 */
locales: {}
Example
レイアウトと設定をいじるとこんな感じの図中で編集可能な図形が描画できます。
See the Pen my-plotly-sample by icchi (@icchi) on CodePen.