概要
・kaggleのフリーのデータセットを使い、電力需要をARモデルで予測。
・ARモデルとは時系列で有名なARIMAモデルやSARIMAモデルのAR部分を利用したもの。
・モデルを利用する前のデータの可視化やモデルの当てはまりの良さまで時系列解析全体の流れを意識して書いた記事。
・ARモデルとは1期前のデータが次の期に影響するという考えをモデルにしたもの。
・数式:$E(y_t|y_{t-1}) = b_0 + b_1*y_{t-1} + \epsilon$
データセット
Prediction of electric power
Let's share code and approaches so as to improve our data-science skill each other.
ライブラリー
import statsmodels.api as sm
from statsmodels.tsa.ar_model import AutoReg
from statsmodels.tsa.stattools import adfuller # ディッキーフラー検定
from statsmodels.stats.diagnostic import acorr_ljungbox # リュングボックス検定

import pandas as pd
import numpy as np
import matplotlib.pyplot as plt
import seaborn as sns

def get_key_with_min_value(dictionary): #辞書型から最小値を取る関数
    min_value = min(dictionary.values())
    min_keys = [key for key, value in dictionary.items() if value == min_value]
    return min_keys
前処理
データを読み込み後、日付をdatetime型に変換。同じ日付のデータは1まとめにし、平均の値で補完。
train = pd.read_csv('data/train_df.csv')
train['DATE'] = pd.to_datetime(train.DATE)
train.sort_values(by='DATE', inplace=True)
group_train = train.groupby('DATE').mean()
group_train.sort_values(by='DATE', inplace=True)
# 訓練データとテストデータを準備
len_test = 24
df_train = group_train.POWER[:len(group_train) -len_test]
df_test = group_train.POWER[len(group_train)-len_test:]
①何も考えずに、ARモデルを適用する
1、時系列をプロット
sns.lineplot(group_train.POWER)
スパイクがあることやトレンド、もしかしたら季節性もあるかもしれない。
2、自己相関、偏自己相関を確認
#自己相関係数のプロット
sm.graphics.tsa.plot_acf(group_train.POWER, lags=150)
plt.xlabel('lags')
plt.ylabel('acf')

#偏自己相関係数のプロット
sm.graphics.tsa.plot_pacf(group_train.POWER, lags=150)
plt.xlabel('lags')
plt.ylabel('pacf')
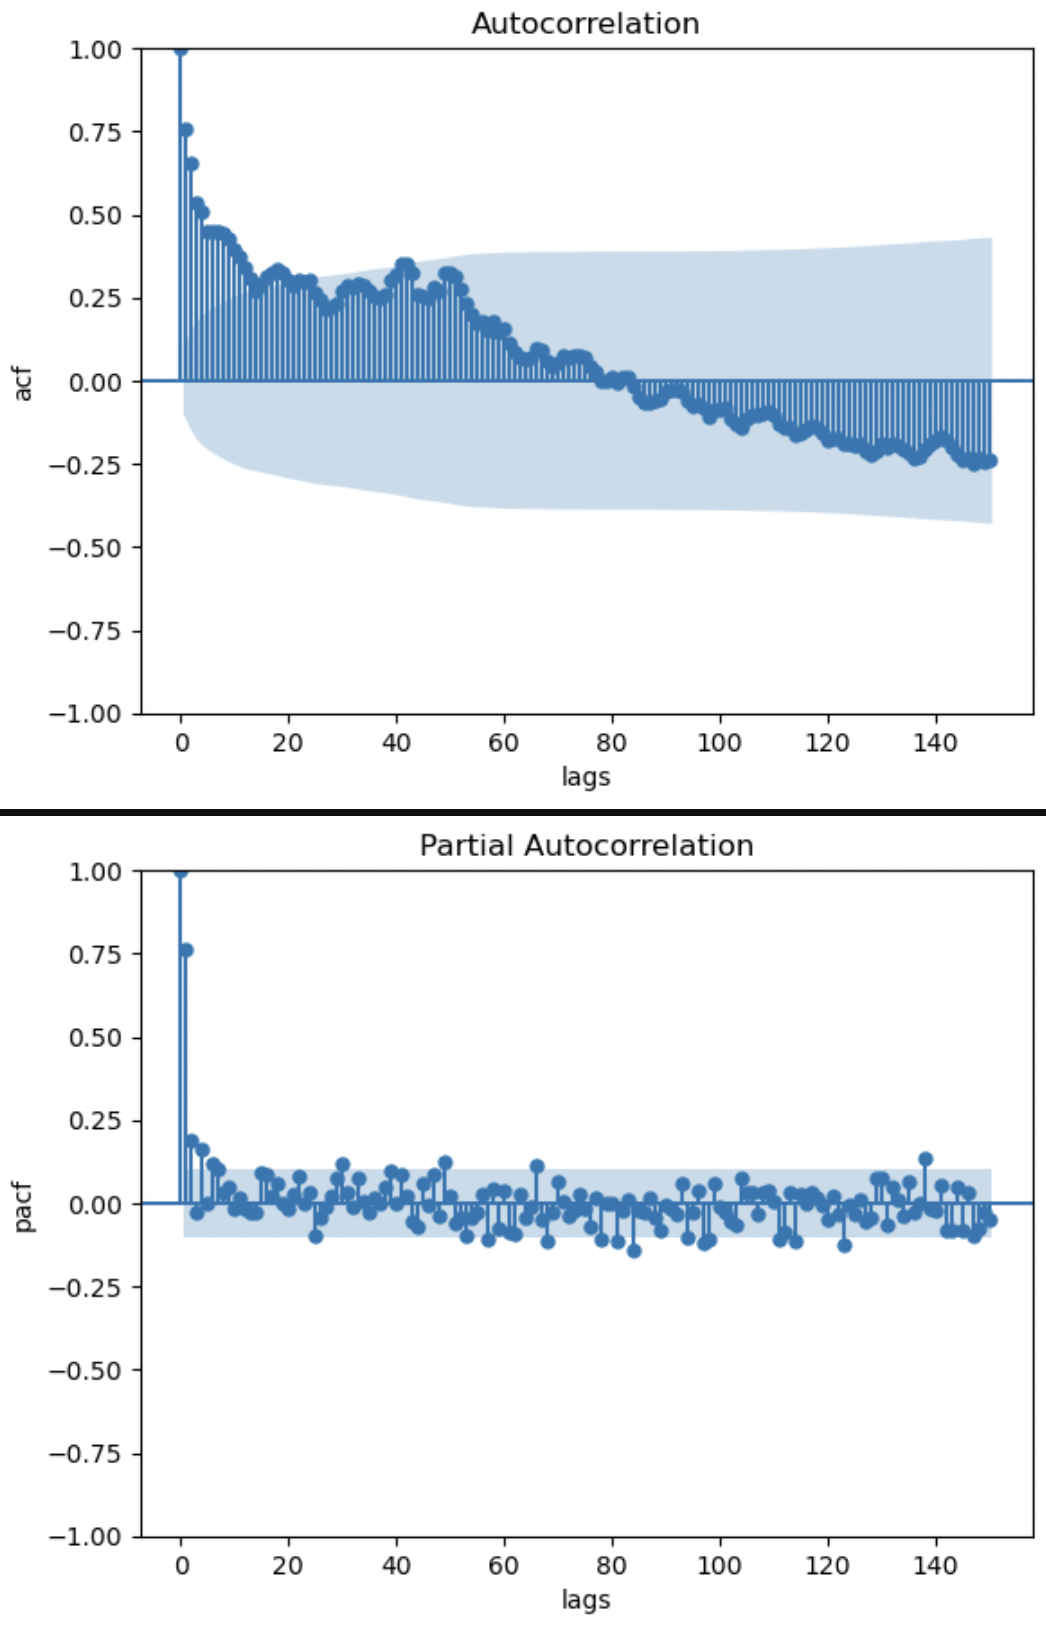
自己相関グラフはトレンドがある特有のグラフになっている。偏自己相関グラフより、時折、95%信頼区間を抜けて相関を示す期が存在することがわかる。偏自己相関グラフをみると3期前までは現在の値に影響しているので、おそらくモデルの次数は3が妥当かもしれない。後ほど、AICの値を使い次数を決定する。
・自己相関とはlagを発生させた時の期との相関をみている。
・偏自己相関とは比較する期同士以外の他の期の影響を取り除いた時の相関を確認している。時系列データは1つ前の期の影響を受ける。例えば現在と1期前の純粋な相関をみたい場合、2期前が現在と1期前に強く影響している時、擬似相関のようなものが発生し、本当の相関を見ることができない。この2期前の影響を取り除いた時の相関が偏自己相関。
3、ディッキーフラー検定
帰無仮説:系列データは単位根AR過程である
対立仮説:系列データは定常AR過程である
test_reslut = adfuller(df_train)
print('p-value:',test_reslut[1], 'lags_used:',test_reslut[2])
# p-value: 0.0004056951072966115 lags_used: 3,結果は帰無仮説を棄却、定常AR過程である
対立仮説を採用。このデータをモデルに学習させる。もし、帰無仮説を棄却できないのなら、階差や対数をとり定常性を発見する。
4、モデルの次数を決定(AICで)
results_list = {}
for i in range(150):
    ar_model = AutoReg(df_train, lags=i+1)
    result = ar_model.fit()
    results_list[i] = result.aic
get_key_with_min_value(results_list)[0]
# 149
AICが最も小さくなるのは次数が149である時がわかったので、今回はコレを採用。
5、モデルで予測
fig, ax = plt.subplots(figsize=(20, 6))

min_lag = get_key_with_min_value(results_list)[0] + 1
ar_model = AutoReg(df_train, lags=min_lag)
result = ar_model.fit()

forecast = result.forecast(len_test)
forecast.index = df_test.index

ax.plot(forecast, ls="-", color="r", label="predicted")
ax.plot(group_train.POWER, ls="-")
ぱっと見ではあまり当てはまりが良いとは思えない。が大まかな方向感は抑えているように見える。
6、モデルの当てはまりの良さを確認(今回はARモデルの誤差項の偏自己相関で)
ARモデルの誤差項の項の偏自己相関を確認し、モデルが正しくできているか確認する。
# 残差の偏自己相関を確認
sm.graphics.tsa.plot_pacf(result.resid, lags=50)
plt.xlabel('lags')
plt.ylabel('pacf')

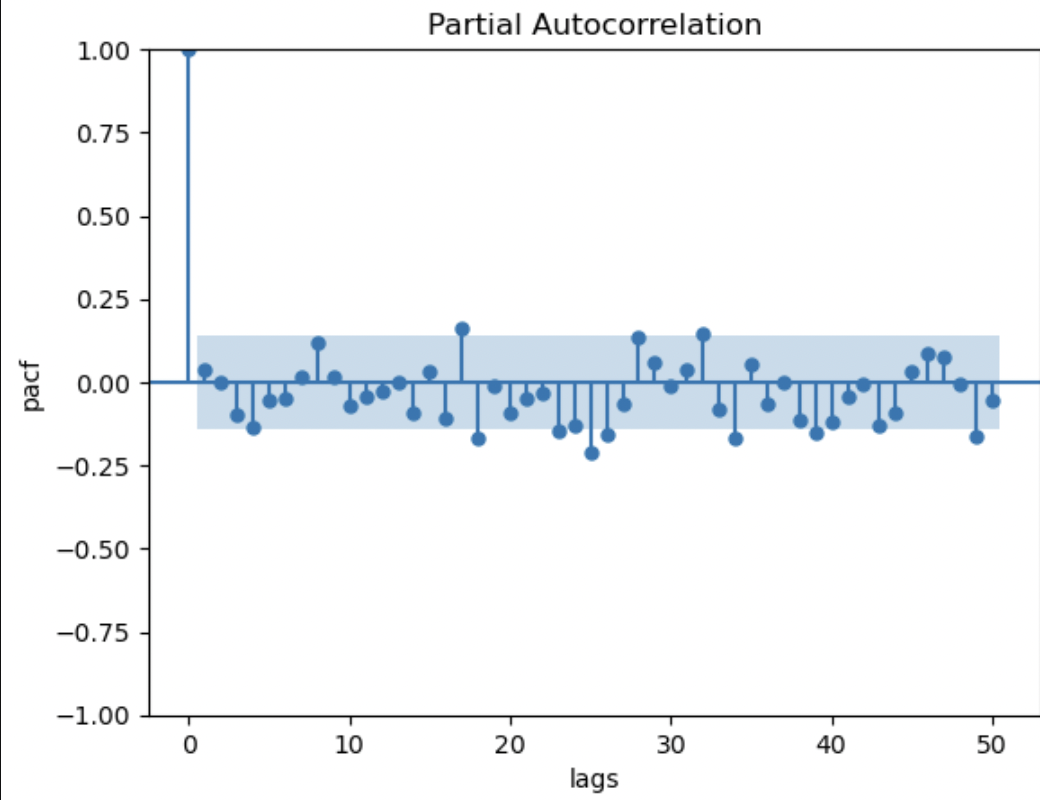
問題ないのかどうか判別がしづらい(所々95%信頼区間を抜けて、互いに独立であるはずの誤差項と偏自己相関があるように見える)。
仕方ないので、リュングボックス検定を利用。
帰無仮説:データは系列相関を示さない
対立仮説:データは系列相関を示す。
# リュングボックス検定
# 帰無仮説:系列相関を示さない
acorr_ljungbox(result.resid, lags=150)
# p-value 0.1797
よって帰無仮説は棄却されず、系列相関を示さないという主張を仕方なく受容する。
以上で、「データの確認→相関の確認→モデルを適用していいかどうかの判断→モデルの構造の決定→モデルで予測→予測結果の評価→モデルの当てはまりの良さの確認」の一連の流れを終了。
②階差をとってからARモデルを適用する
モデルが微妙だったのはデータが定常性を示していなかったせいではないのか?という疑問ができたので、階差をとってモデルを適用してみる。結論はよりダメな結果になった。
1、時系列をプロット
差分をとり、可視化
sns.lineplot(df_train.diff())
より定常性のあるデータらしくになった。
2、自己相関、偏自己相関を確認
#自己相関係数のプロット
sm.graphics.tsa.plot_acf(group_train.POWER.diff()[1:], lags=150)
plt.xlabel('lags')
plt.ylabel('acf')

#偏自己相関係数のプロット
sm.graphics.tsa.plot_pacf(group_train.POWER.diff()[1:], lags=150)
plt.xlabel('lags')
plt.ylabel('pacf')
上記分析①とあまり変わらず
3、ディッキーフラー検定
# 差分に対してディッキーフラーを行う
adfuller(df_train.diff()[1:])
# p-value 2.9185367658768694e-27,
帰無仮説を棄却し、データは定常AR過程であるという対立仮説を採用。モデルを当てはめます。
4、モデルの次数を決定(AICで)
results_list = {}
for i in range(150):
    model = AutoReg(df_train.diff()[1:], lags=i+1)
    res = model.fit()
    results_list[i] = result.aic
get_key_with_min_value(results_list)[0]
# 0
次数が1の時、AICが最小になる。
5、モデルで予測
fig, ax = plt.subplots(figsize=(20, 6))

min_lag = get_key_with_min_value(results_list)[0] + 1
model = AutoReg(df_train.diff()[1:], lags=min_lag)
result = model.fit()

forecast = result.forecast(len(df_train) + len(df_test)).cumsum()[:len(df_test)] + df_train[-1]
forecast.index = df_test.index
# forecast = result.forecast(len(group_train.POWER))
# forecast.index = group_train.POWER.index

ax.plot(forecast, ls="-", color="r", label="predicted")
ax.plot(group_train.POWER, ls="-")
当てはまり悪すぎる。
6、モデルの当てはまりの良さを確認(目視、数字)
# 残差の偏自己相関を確認
sm.graphics.tsa.plot_pacf(result.resid, lags=50)
plt.xlabel('lags')
plt.ylabel('pacf')
ARモデルの偏自己相関を確認すると、いいように思える。
# リュングボックス検定
acorr_ljungbox(result.resid)
# p-value:0.6815
# 帰無仮説:系列相関を示さない
予測はダメだが、モデルの当てはまり自体は良い。
参考文献


