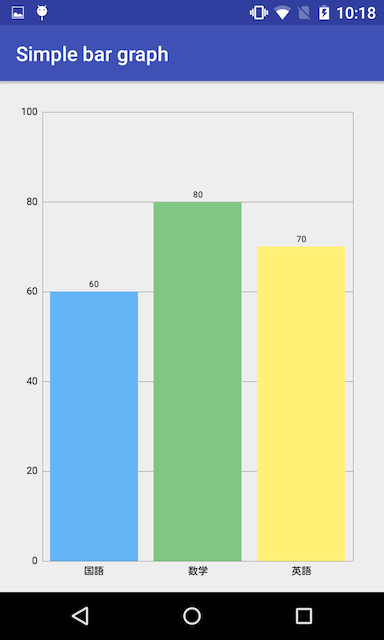
要約
MPAndroidChartでシンプルなグラフを作ろうと思ったら、
機能が充実しているおかげで逆にシンプルなグラフを作るのが分かりにくかった。
ver3.0.2になって前バージョンと少し変わっていた(x軸のラベルの表示とか…)
やりたかったこと
特に分かりにくかった点
・x軸にラベルを表示
・グラフ毎に任意の色を設定
やり方
public class MainActivity extends AppCompatActivity {

    protected BarChart chart;

    @Override
    protected void onCreate(Bundle savedInstanceState) {
        super.onCreate(savedInstanceState);
        setContentView(R.layout.activity_main);

        chart = (BarChart) findViewById(R.id.chart1);

        //表示データ取得
        BarData data = new BarData(getBarData());
        chart.setData(data);

        //Y軸(左)
        YAxis left = chart.getAxisLeft();
        left.setAxisMinimum(0);
        left.setAxisMaximum(100);
        left.setLabelCount(5);
        left.setDrawTopYLabelEntry(true);
        //整数表示に
        left.setValueFormatter(new IAxisValueFormatter() {
            @Override
            public String getFormattedValue(float value, AxisBase axis) {
                return "" + (int)value;
            }
        });

        //Y軸(右)
        YAxis right = chart.getAxisRight();
        right.setDrawLabels(false);
        right.setDrawGridLines(false);
        right.setDrawZeroLine(true);
        right.setDrawTopYLabelEntry(true);

        //X軸
        XAxis xAxis = chart.getXAxis();
        //X軸に表示するLabelのリスト(最初の""は原点の位置)
        final String[] labels = {"","国語", "数学", "英語"};
                xAxis.setValueFormatter(new IndexAxisValueFormatter(labels));
        XAxis bottomAxis = chart.getXAxis();
        bottomAxis.setPosition(XAxis.XAxisPosition.BOTTOM);
        bottomAxis.setDrawLabels(true);
        bottomAxis.setDrawGridLines(false);
        bottomAxis.setDrawAxisLine(true);

        //グラフ上の表示
        chart.setDrawValueAboveBar(true);
        chart.getDescription().setEnabled(false);
        chart.setClickable(false);

        //凡例
        chart.getLegend().setEnabled(false);

        chart.setScaleEnabled(false);
        //アニメーション
        chart.animateY(1200, Easing.EasingOption.Linear);
    }

    //棒グラフのデータを取得
    private List<IBarDataSet> getBarData(){
                //表示させるデータ
        ArrayList<BarEntry> entries = new ArrayList<>();
        entries.add(new BarEntry(1, 60));
        entries.add(new BarEntry(2, 80));
        entries.add(new BarEntry(3, 70));
        List<IBarDataSet> bars = new ArrayList<>();
        BarDataSet dataSet = new BarDataSet(entries, "bar");

        //整数で表示
        dataSet.setValueFormatter(new IValueFormatter() {
            @Override
            public String getFormattedValue(float value, Entry entry, int dataSetIndex, ViewPortHandler viewPortHandler) {
                return "" + (int) value;
            }
        });
        //ハイライトさせない
        dataSet.setHighlightEnabled(false);

        //Barの色をセット
        dataSet.setColors(new int[]{R.color.material_blue, R.color.material_green, R.color.material_yellow}, this);
        bars.add(dataSet);

        return bars;
    }

}
x軸にラベルを表示するにはデータのx軸に表示される数値をラベルに変換する感じ。
グラフ毎に任意の色を設定はデータのリストに色のリストをセットすることで実行可能。
その他、デフォルトだと拡大縮小ができたり、タップするとハイライトされたり、
目盛りがやたら多かったりと調整するのに結構色々やらないといけなかった。
参考
x軸にラベル(https://github.com/PhilJay/MPAndroidChart/issues/2044)
グラフ毎に色(https://stackoverflow.com/questions/38872181/mpandroidchart-bar-chart-how-to-change-color-of-each-label)
