前回からの続き。
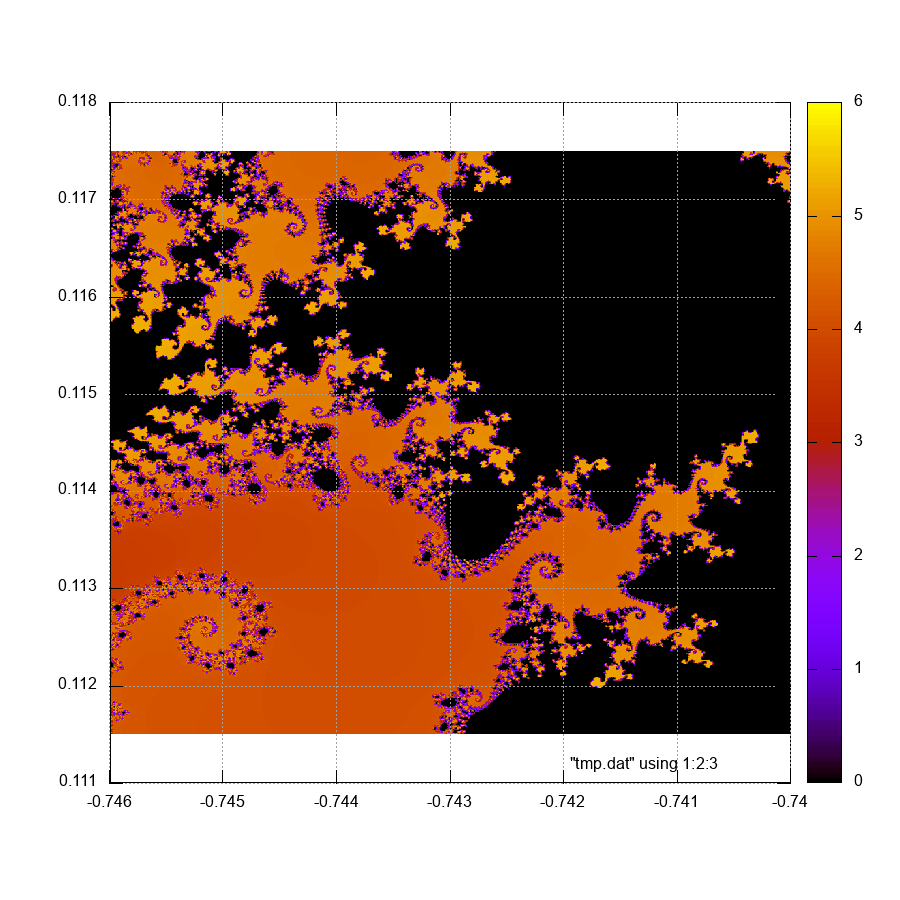
マンデルブロ集合を生成するクラスとしてMandelbrotを定義して、生成されたマンデルブロ集合をcolumns_save(s関数と同じように使用するためにPyGnuplotモジュールに結合させてgp.colssとして使用)でtmp.datに出力、gnuplotで描写している。
前回からの変更点は主にMandelbrotクラスのx軸、y軸を生成するものとしてarangeメソッドからlinspaceメソッドに切り替えて、Gnuplotと同じくサンプル数を指定するものとしてsample, isosample変数で分割するようにした。
マンデルブロ集合の生成を、マンデルブロ集合を返すmandelbrot_setプロパティの中で呼び出すことにした。また、すでにマンデルブロ集合を生成済みであれば、再計算はせず生成した集合をそのまま返すようにして、計算量を減らした。
gnuplot側の工夫として、"set pm3d map" で等高線をグラデーションで出力できるようにした(試行錯誤したらできるようになった。前回なんでできなかったのかよくわからない)。
描写する領域としてはこちらを参考にして領域設定した。(が、リンク先のような画像が出ていない。)
# !/usr/bin/env python
import numpy as np

def columns_save(data, filename='tmp.dat'):
    '''
    saves numbers arrays and text into filename (default = 'tmp.dat)
    (assumes equal sizes and 2D data sets)
    >>> s(data, filename='tmp.dat')  # overwrites/creates tmp.dat
    '''
    file = open(filename, 'w')
    columns = len(data)
    rows = len(data[0])
    for i in range(columns):
        if data[i] == []:
            file.write('\n')
            continue
        for j in range(rows):
            file.write(str(data[i][j]))
            file.write(' ')
        file.write('\n')
        if i % 1000 == 0 :
            file.flush()  # write once after every 1000 entries
    file.close()  # write the rest

import PyGnuplot as gp
gp.colss = columns_save

class Mandelbrot:

    scale       = 0.003
    sample      = 1000
    isosample   = 1000
    cnter=complex(-0.743,0.1145)
    def __init__(self):
        self._xbase = np.linspace(-self.scale,self.scale,self.sample)
        self._ybase = np.linspace(-self.scale,self.scale,self.isosample)
        self._cbases = []
        self._mset = []

    def __gen_cbases(self):
        if self._cbases != []: return
        for x in self._xbase:
            self._cbases.append([])
            for y in self._ybase:
                self._cbases[-1].append(complex(x,y)+self.cnter)
        return

    def mandelbrot(self,c):
        z = 0j
        for n in range(1,200):
            z = z**2 + c
            if np.abs(z) > 2.0:
                print(np.log(n))
                return np.log(n)
        return 0

    def gen_mandelbrot(self):
        if self._mset != []: return
        self.__gen_cbases()
        for cs in self._cbases:
            for c in cs:
                self._mset.append([c.real, c.imag, self.mandelbrot(c)])
            self._mset.append([])
        return

    def reset(self):
        self._cbases = []
        self._mset = []
        return

    @property
    def mandelbrot_set(self):
        if self._mset == []:
            self.gen_mandelbrot()
        return self._mset

if __name__ == "__main__":
    m = Mandelbrot()
    print("calc")
    gp.colss(m.mandelbrot_set)
    gp.c("""
        set term png size 900,900
        set output "m2.png"
        set size square;
        set grid
        set pm3d map
#        set nosurface
#        set contour base
#        set view map
        """)
    gp.c('splot "tmp.dat" using 1:2:3')
生成される画像
課題
マンデルブロ集合の特徴的な図形が出なくなった。
