久々にSplunkを触りたくなったので、適当なデータを探していたところ、レンタル自転車のデータを触ることにした。という始まりから、Splunkを設定して、データをてみた、というのが前回まで。
前回のあらずじ
- レンタル自転車のデータをダウンロード https://www.kaggle.com/c/bike-sharing-demand
- SplunkとMachine Learning Toolkit (MLTK) + Python for Scientific Computing Appの導入
- Appの設定とIndexの作成、データの投入
- 投入したデータをみる
で、最終的に、レンタル数が抜けているデータを機械学習でもって補うというのがお題になっているので、今回は教師データ(train.csv)から機械学習モデルを作成して、実際にtest.csvに対してPredictを実施するところまでいければいいかな、と。
で、前回の最後にちらっと書いた、設定漏れの件のせいで、splunkのインスタンスを停止後、再度起動したら、データが見えない。。。
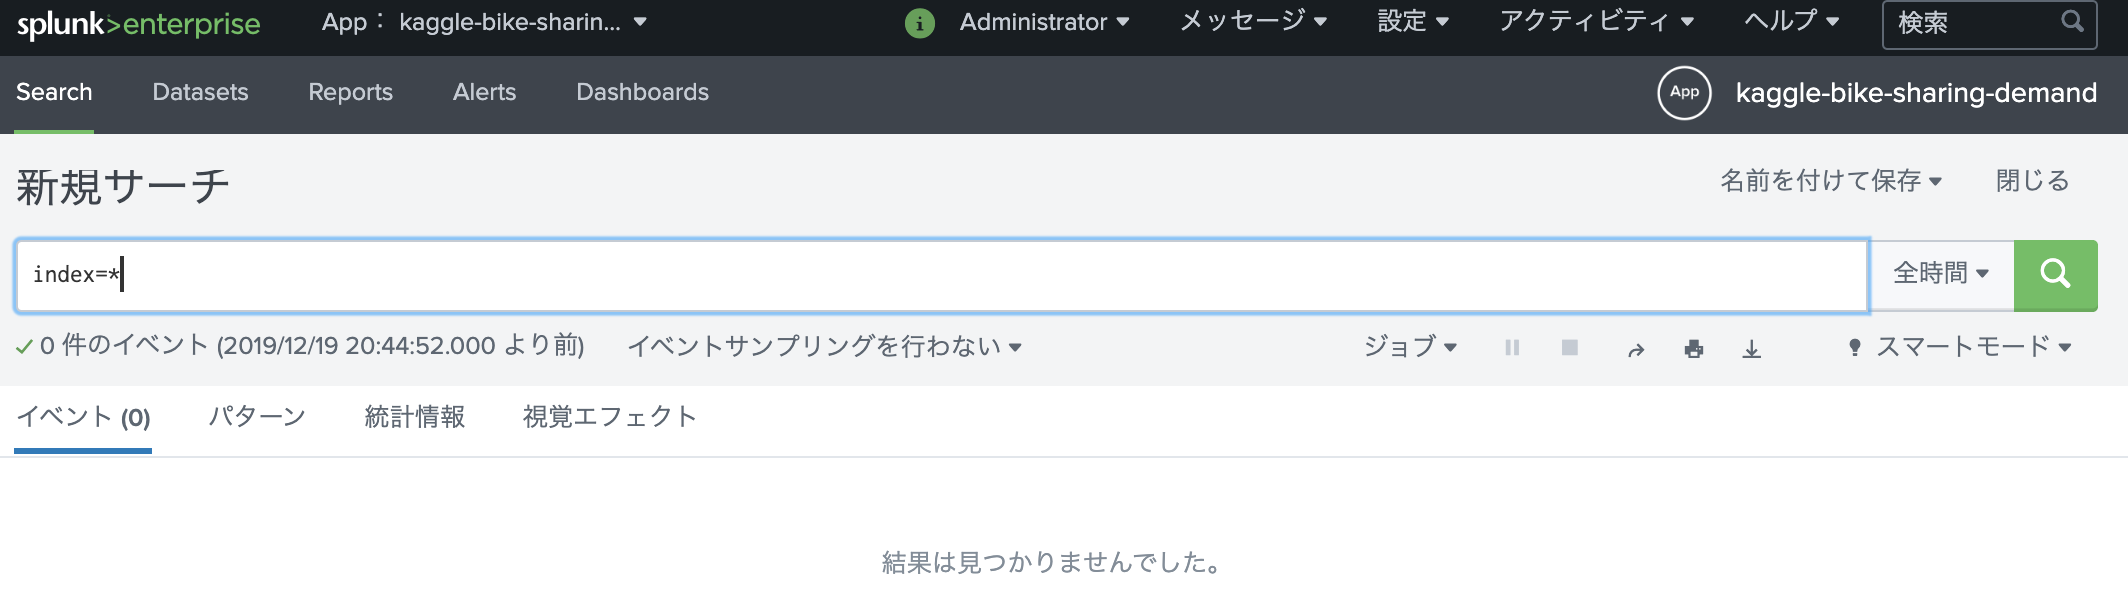
はい、Splunkあるあるの一つである、投入したデータが次から次へと消えていく、、、という奴。
これは、indexの設定で、指定時間過ぎたらデータが十分古い乗で、消したりアーカイブできますよ、ということなんですけど、デフォルトのままだと、だいたい6年前のタイムスタンプの情報を入れるときえるようになってます。
frozenTimePeriodInSecs =
- The number of seconds after which indexed data rolls to frozen.
- If you do not specify a 'coldToFrozenScript', data is deleted when rolled to
frozen. - NOTE: Every event in a bucket must be older than 'frozenTimePeriodInSecs'
seconds before the bucket rolls to frozen. - The highest legal value is 4294967295.
- Default: 188697600 (6 years)
188697600秒より古いイベントはどうにかしまっせ〜という指定です。で、今回扱っているKaggleのデータは、2011年~2012年のものなので、当然きえます。(IndexのBucketがロールするタイミングで発動) なので、私の場合は再起動後に無事データが消えました、ということです。
Indexes.confの修正
$ ./splunk/bin/splunk stop
Stopping splunkd...
Shutting down.  Please wait, as this may take a few minutes.
..
Stopping splunk helpers...

Done.

$ vi ./splunk/etc/apps/kaggle-bike-sharing-demand/local/indexes.conf

[bike]
coldPath = $SPLUNK_DB/bike/colddb
homePath = $SPLUNK_DB/bike/db
thawedPath = $SPLUNK_DB/bike/thaweddb
frozenTimePeriodInSecs = 4294967295
indexes.confを開いて、bikeインデックッスへfrozenTimePeriodInSecs = 4294967295を追加し、起動、そしてCLIからデータも登録してしまう。
$ ./splunk/bin/splunk start
The Splunk web interface is at http://your-ip:8000

$ ./splunk/bin/splunk add oneshot ./kaggle-bike-sharing-demand/train.csv -sourcetype csv-bike -index bike
Your session is invalid.  Please login.
Splunk username: admin
Password:
Oneshot '/Users/mhyugaji/Desktop/CapitalBikeshare-Tripdata/kaggle-bike-sharing-demand/train.csv' added

$ ./splunk/bin/splunk add oneshot ./kaggle-bike-sharing-demand/test.csv -sourcetype csv-bike -index bike
Oneshot '/Users/mhyugaji/Desktop/CapitalBikeshare-Tripdata/kaggle-bike-sharing-demand/test.csv' added
Web UIから確認したら、見えました。
データのおさらい
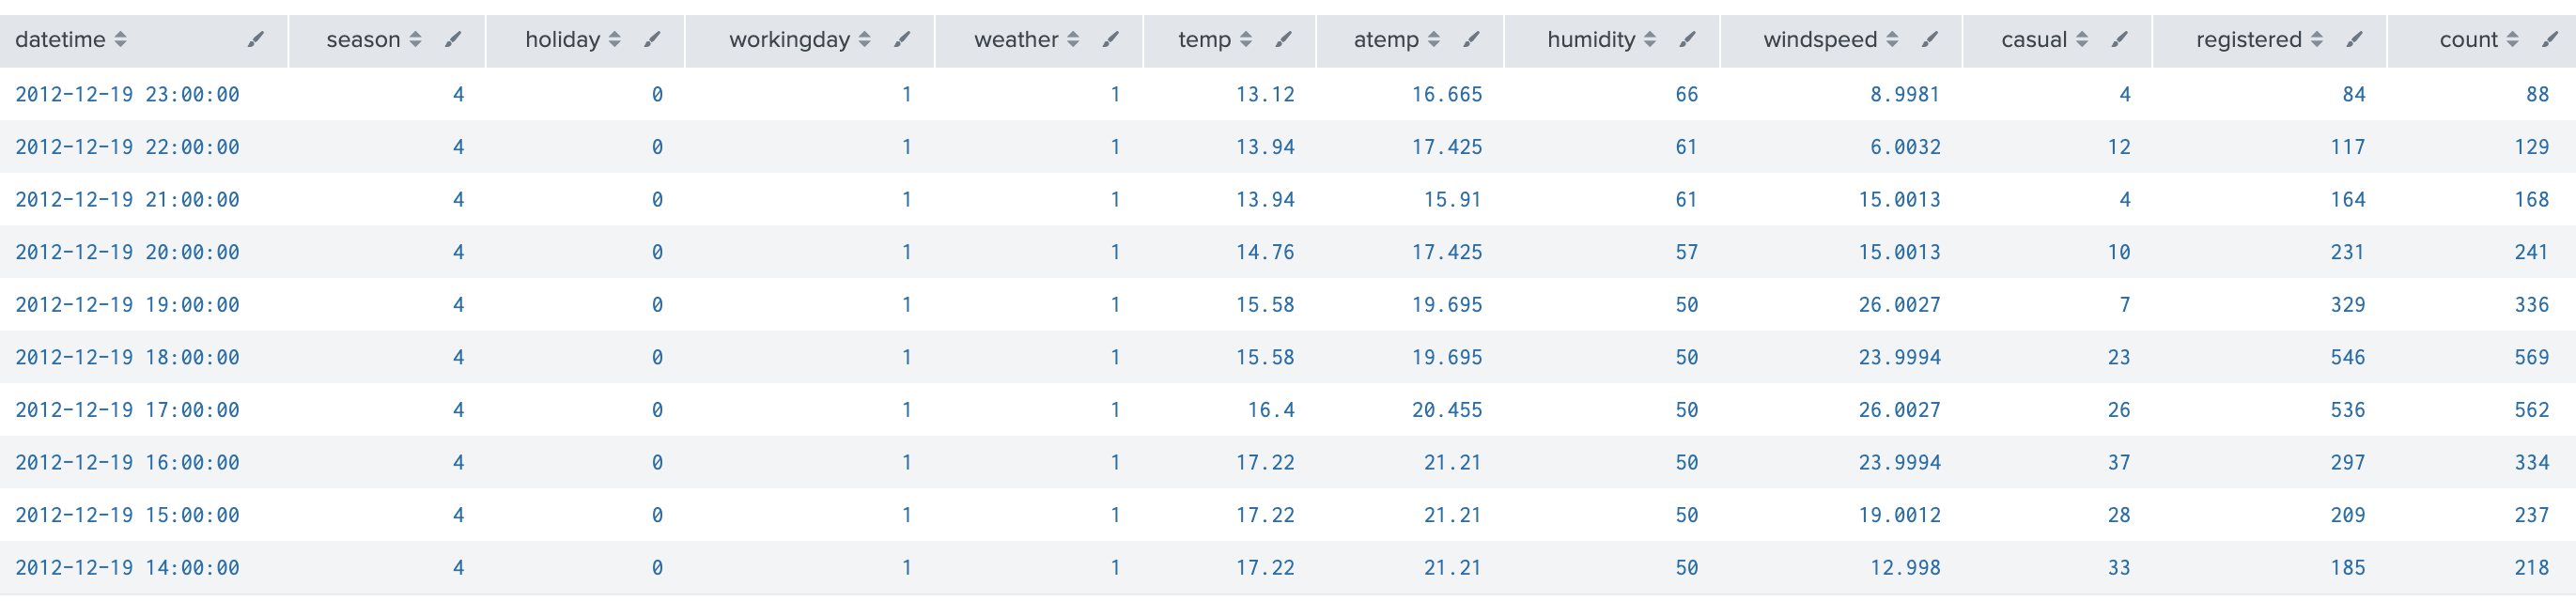
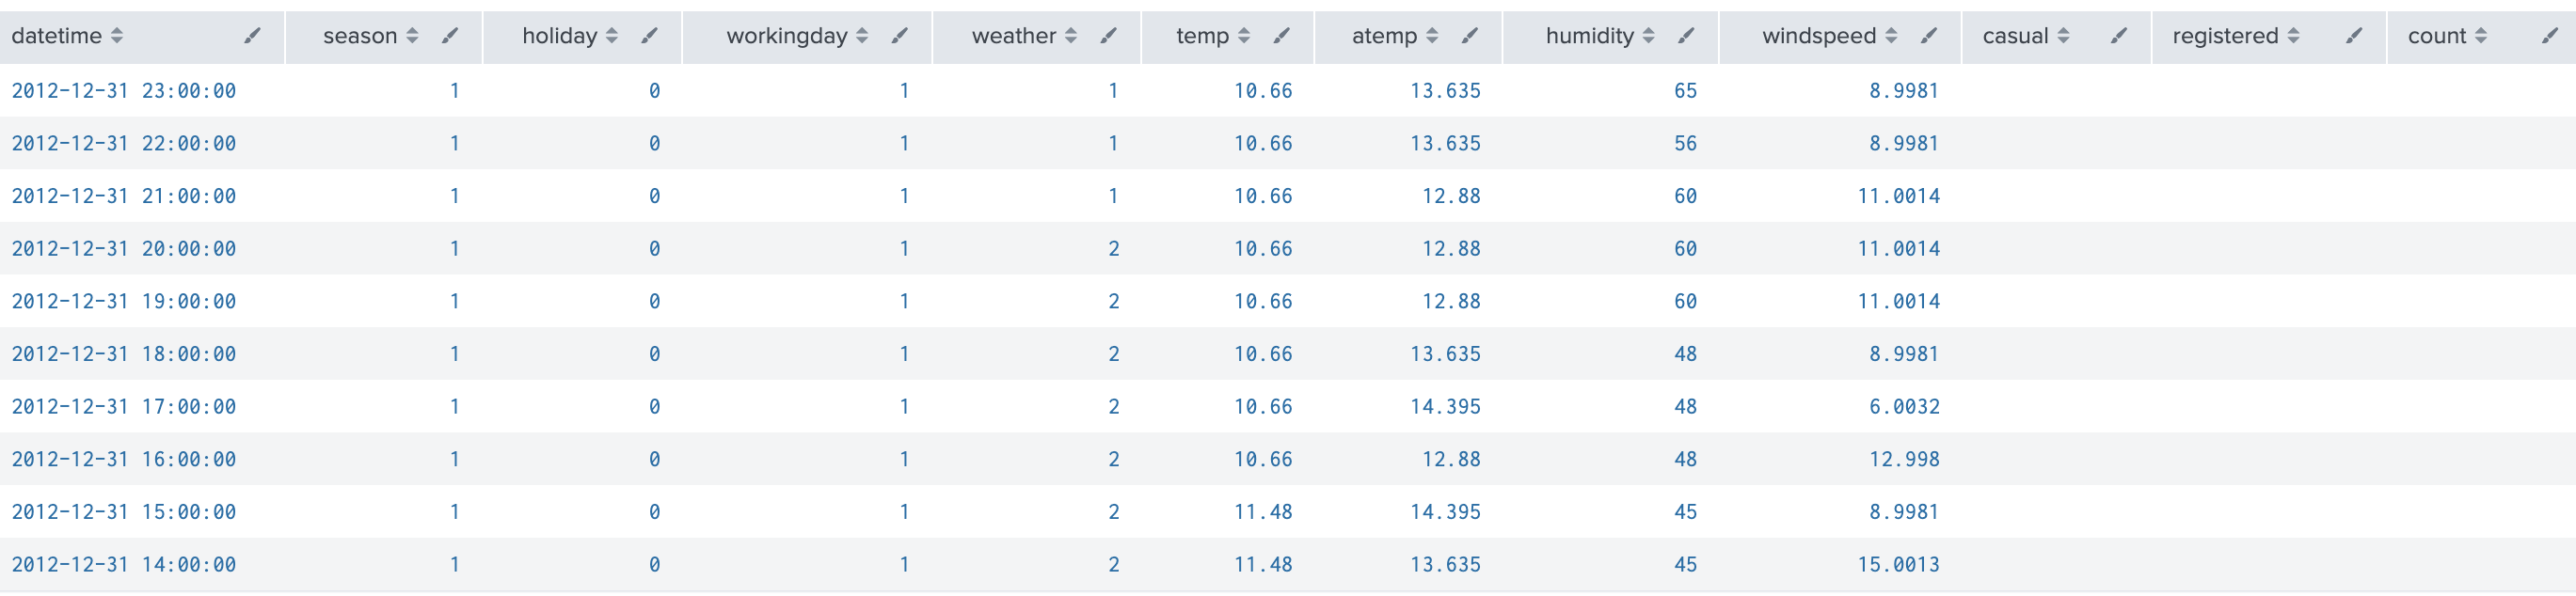
教師データ train.csv
時間帯毎にレンタル数(count)があり、内訳として、casualとregisteredが合算されている。registeredは登録ユーザでcasualは登録していないユーザのレンタル数。それぞれのユーザで利用の季節や時間帯などパターンの違いがあることは前回見た。
index="bike" sourcetype="csv-bike" source=*/train.csv
| head 10
| table datetime,season,holiday,workingday,weather,temp,atemp,humidity,windspeed,casual,registered,count
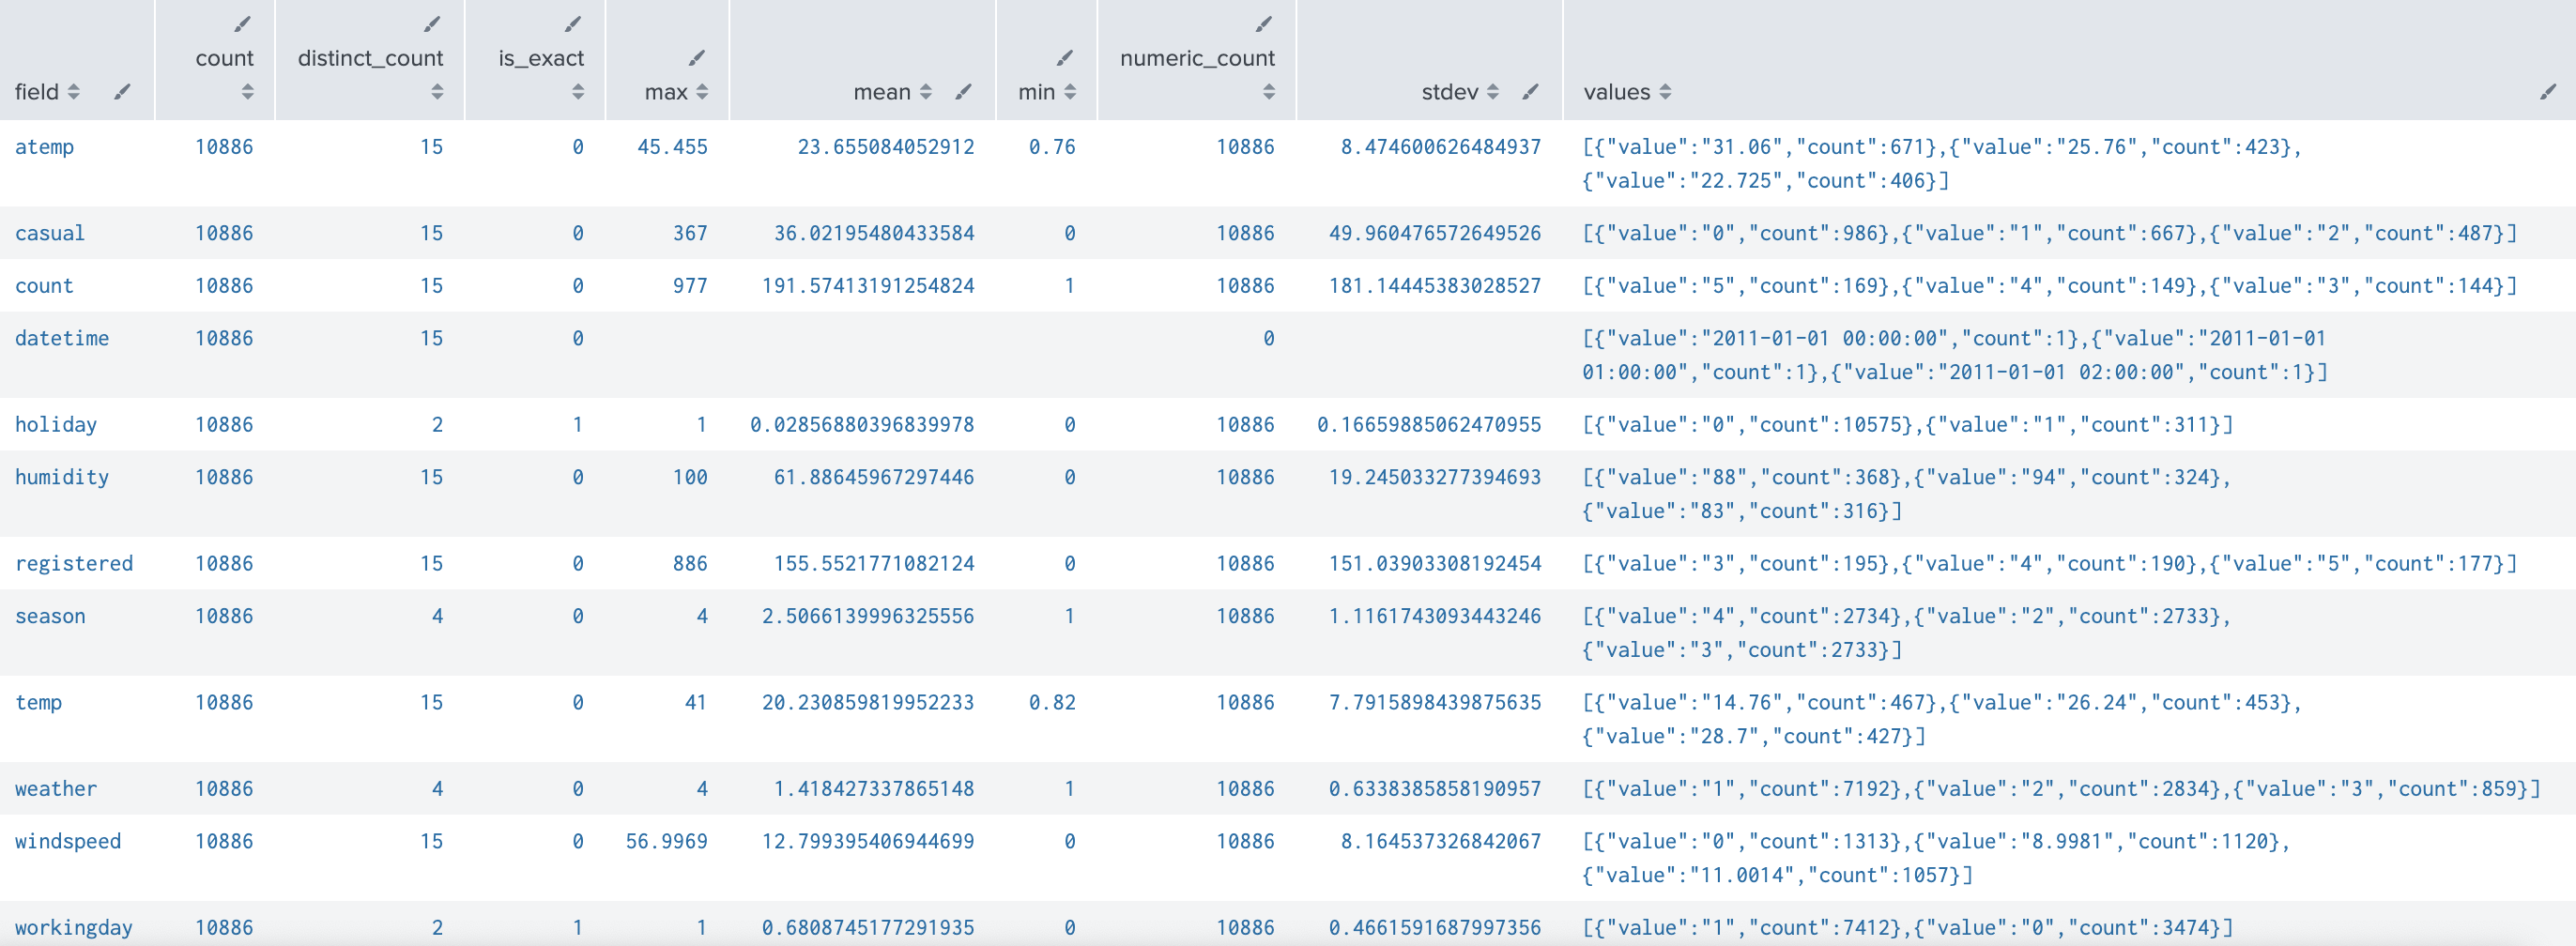
index="bike" sourcetype="csv-bike" source=*/train.csv
| table datetime,season,holiday,workingday,weather,temp,atemp,humidity,windspeed,casual,registered,count
| fieldsummary maxvals=3
テストデータ test.csv
教師データのcasual、registered、countが抜け落ちているテーブル。なので、教師データをもとにモデルを作成し、テストデータに適応して、casual、registered、countを予測することになる。
index="bike" sourcetype="csv-bike" source=*/test.csv
| head 10
| table datetime,season,holiday,workingday,weather,temp,atemp,humidity,windspeed,casual,registered,count
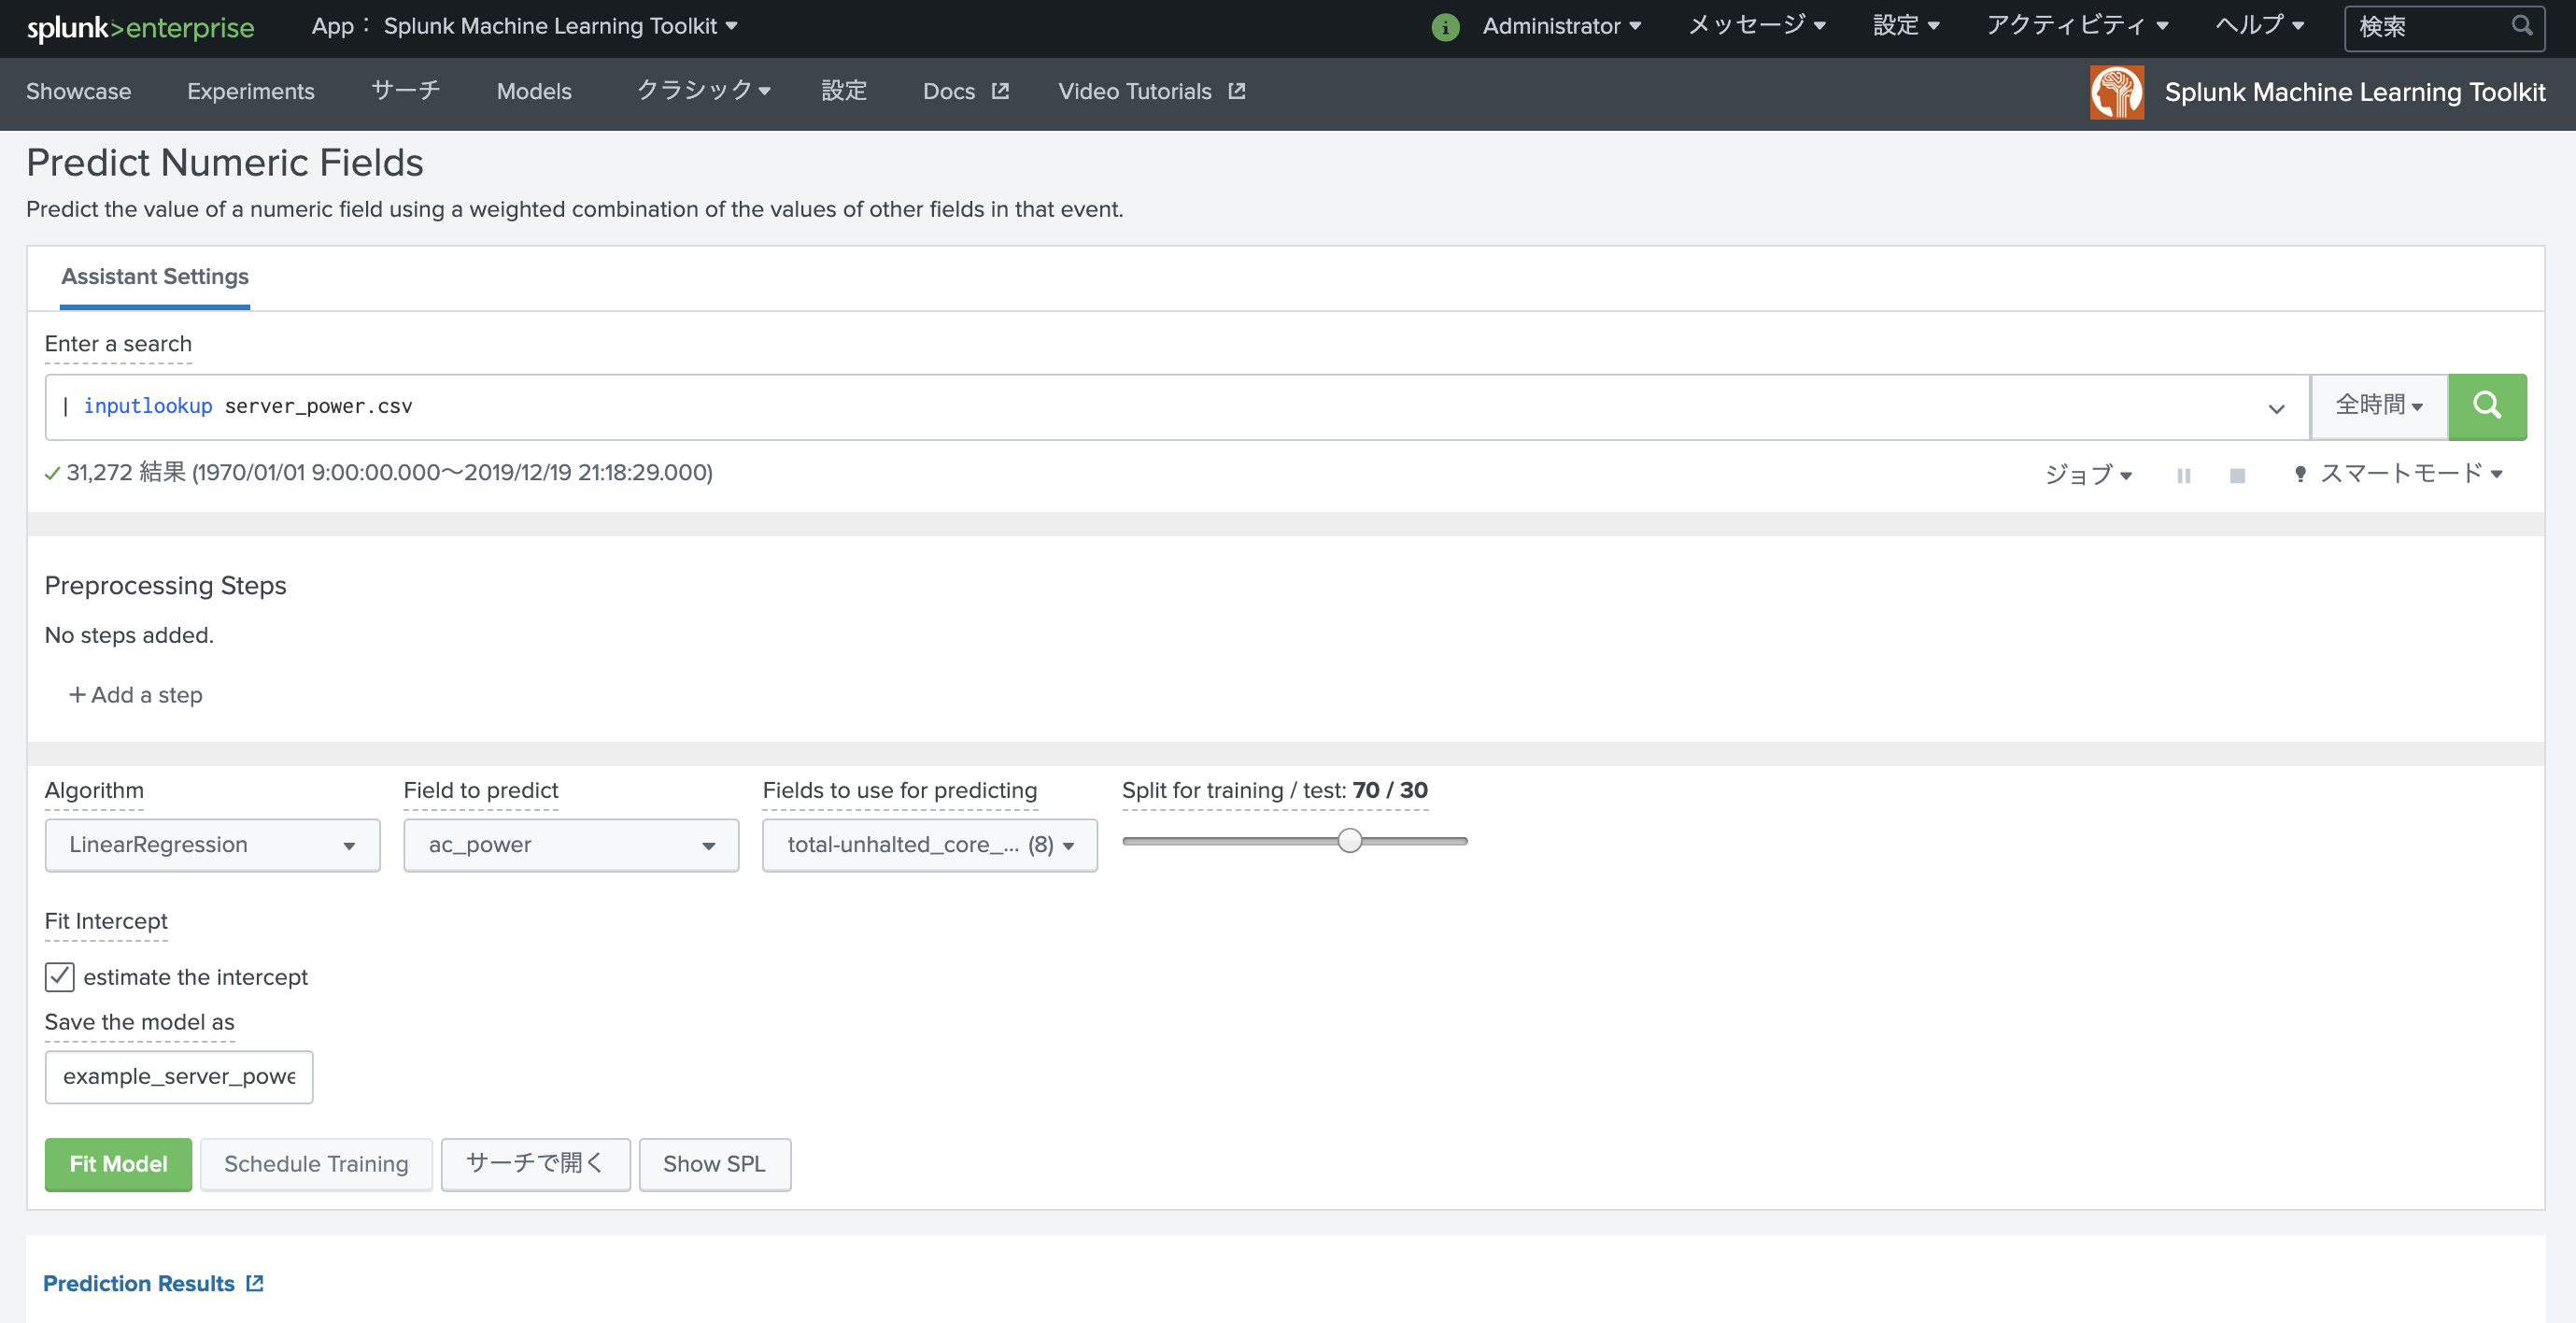
どのAlgorを使うか
インストールしたMLTKにはScikitlearnを始めとする様々なライブラリーがふくまれていて、それらをSplunkのコマンドからかんたんに利用できるようになっている。
また、以下にMLTKのアルゴリズムに関するチートシートなるものもあるので、参考にしちゃいます。
https://www.splunk.com/pdfs/solution-guides/machine-learning-quick-ref-guide.pdf
さて、細かいところを気にしていくほど知識もないので、ざざっと良い加減なところで使い進めていく。
- ハイパーパラメータチューニングとかはまったくすっとばしますが、以下のようなAnswersを投げ込んでおけばきっと有志が何らかの反応をしてくれるでしょう。
https://answers.splunk.com/answers/739741/is-it-possible-to-optimize-hyperparameters-in-mltk.html
さて、いくつか見繕って、実際にtrain.csvに対して実測値と計算値のr^2を評価してみることにします。
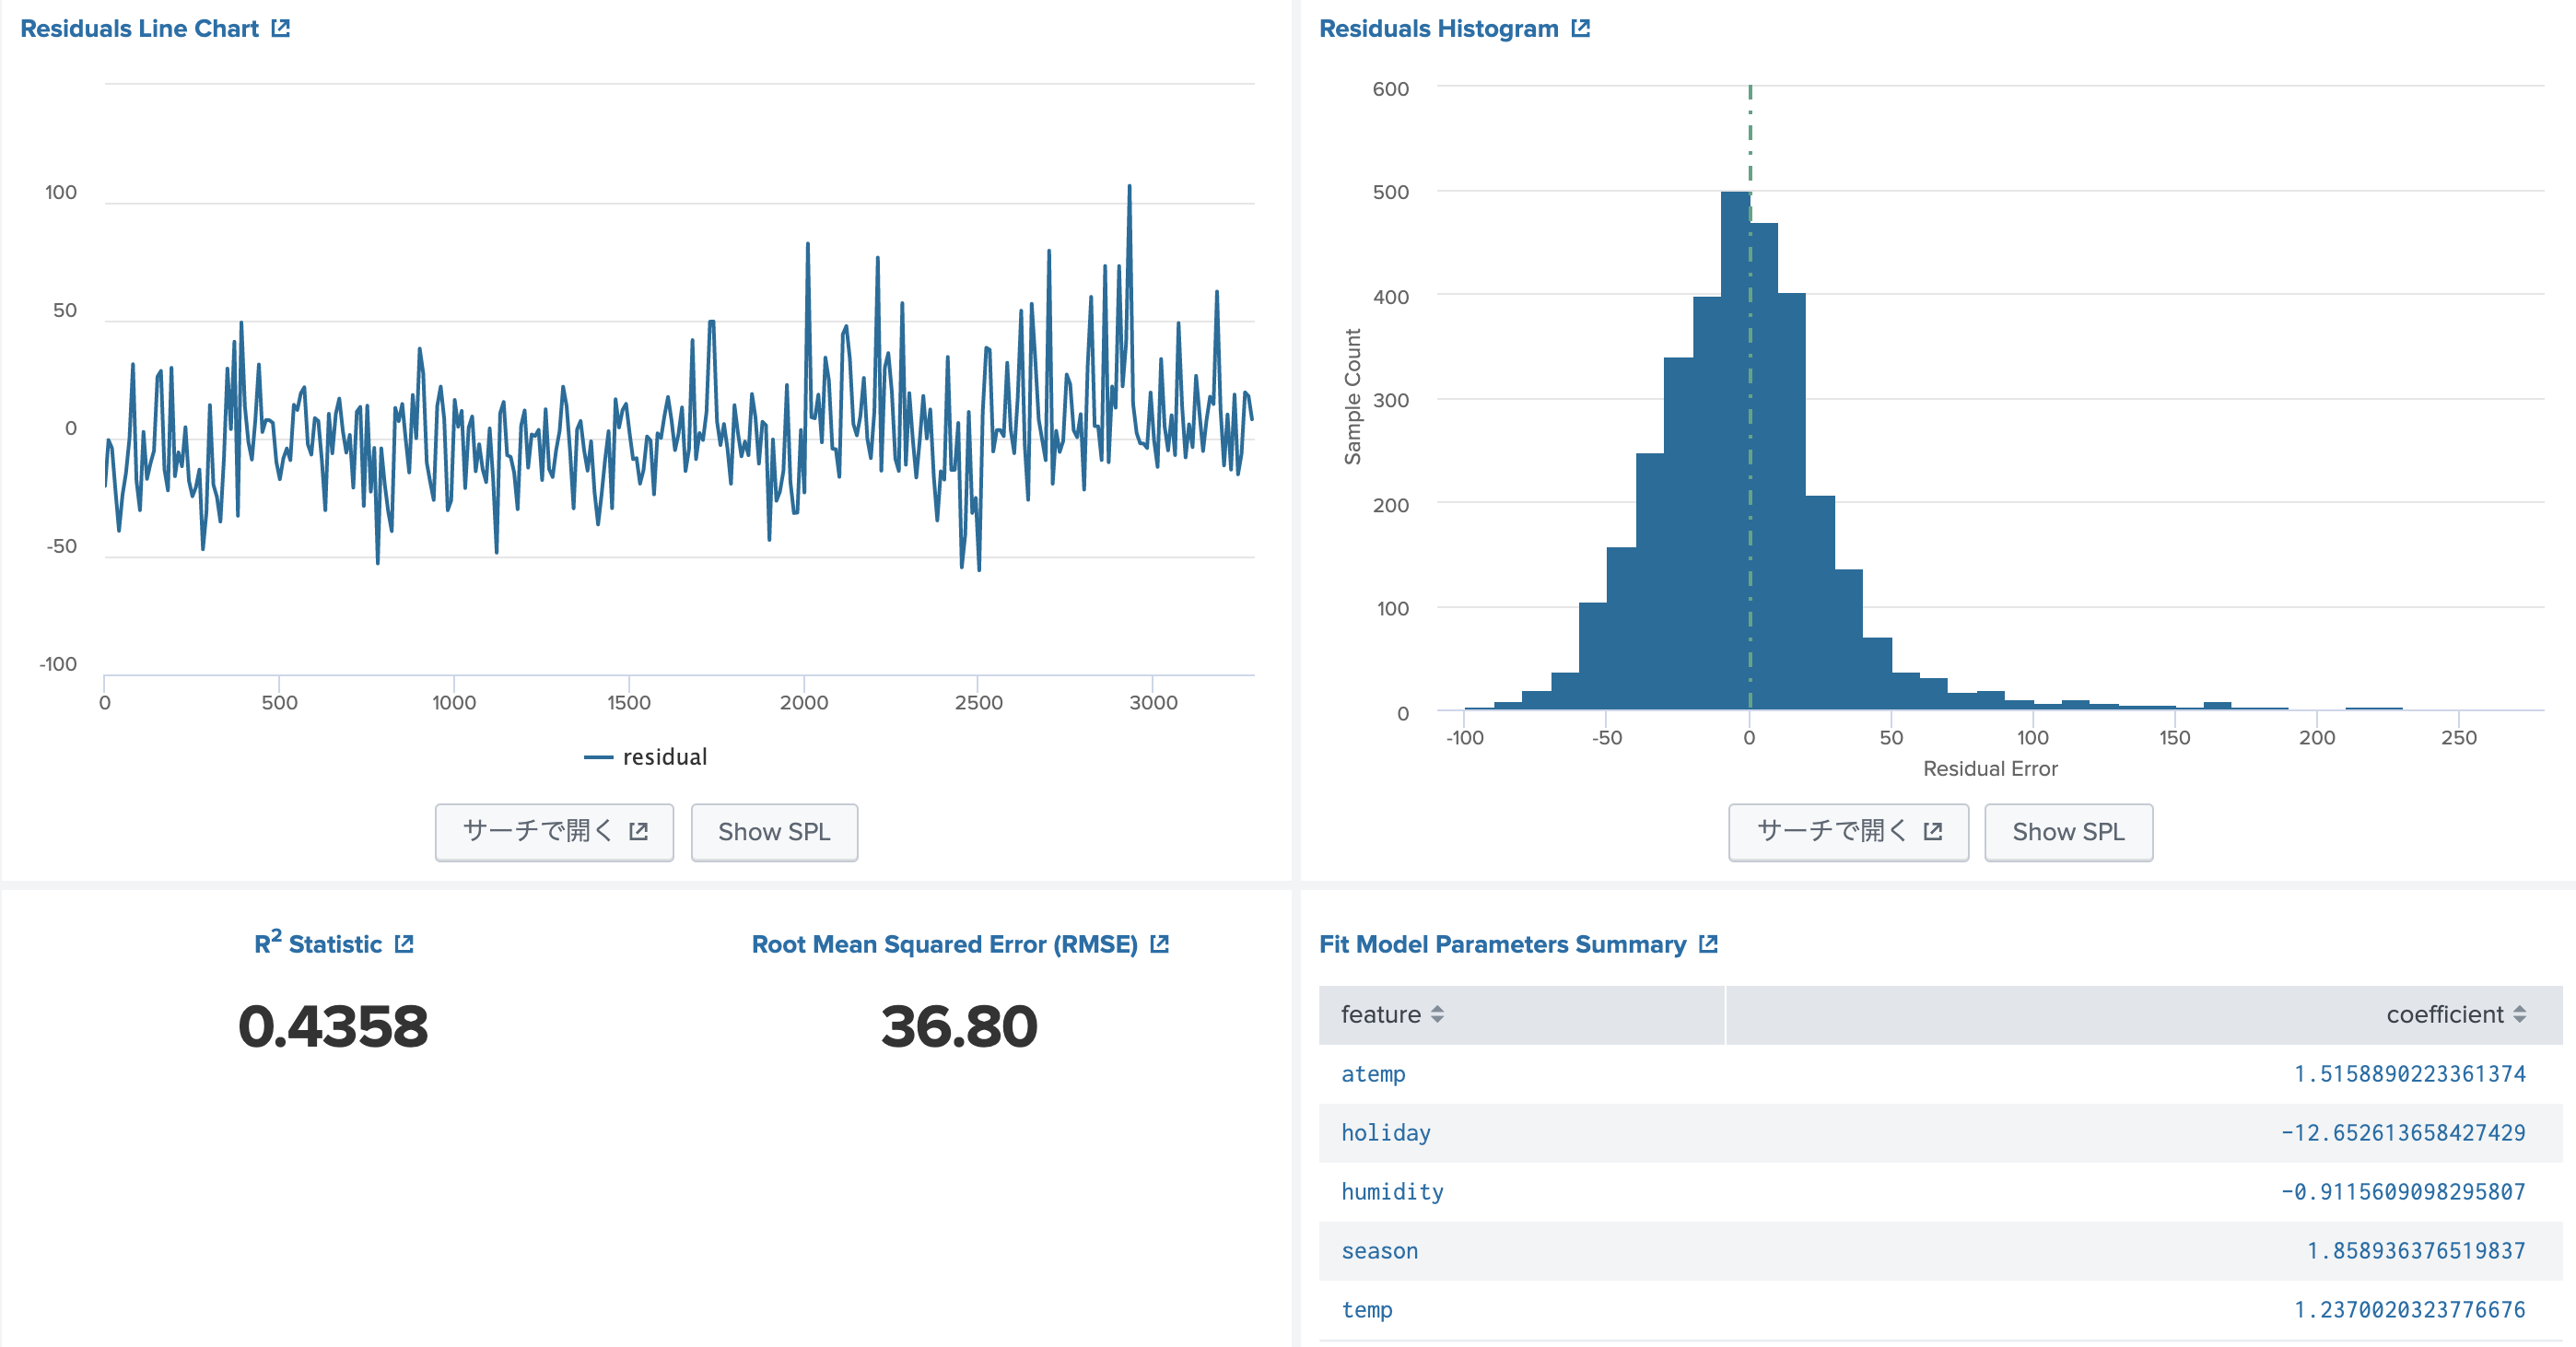
MLTKのツールを使うと上のように統計情報がきれいに出力されるのですが、今回はR2とRMSEだけ出力することにします。
n-foldとかはやりません(雑ですんません)。train.csv全体を使います。
A. Linear Regression
$ ./splunk/bin/splunk search '
> index="bike" sourcetype="csv-bike" source=*/train.csv
> | table _time,season,holiday,workingday,weather,temp,atemp,humidity,windspeed,casual,registered,count
> | fit LinearRegression "casual" from "season" "holiday" "workingday" "weather" "temp" "atemp" "humidity" "windspeed"
> | multireport
> [ score r2_score "casual" against "predicted(casual)"
> | eval rSquared = round(r2_score,4) ]
> [ score mean_squared_error "casual" against "predicted(casual)"
> | eval RMSE = round(sqrt(mean_squared_error),2) ]
> | table RMSE rSquared
> | stats first(*) as *
> ' -preview false
RMSE  rSquared
----- --------
37.42   0.4390
B. Random Forest Regressor
$ ./splunk/bin/splunk search '
> index="bike" sourcetype="csv-bike" source=*/train.csv
> | table _time,season,holiday,workingday,weather,temp,atemp,humidity,windspeed,casual,registered,count
> | fit RandomForestRegressor "casual" from "season" "holiday" "workingday" "weather" "temp" "atemp" "humidity" "windspeed"
> | multireport
> [ score r2_score "casual" against "predicted(casual)"
> | eval rSquared = round(r2_score,4) ]
> [ score mean_squared_error "casual" against "predicted(casual)"
> | eval RMSE = round(sqrt(mean_squared_error),2) ]
> | table RMSE rSquared
> | stats first(*) as *
> ' -preview false
RMSE  rSquared
----- --------
15.29   0.9063
C. Dicision Tree Regressor
$ ./splunk/bin/splunk search '
> index="bike" sourcetype="csv-bike" source=*/train.csv
> | table _time,season,holiday,workingday,weather,temp,atemp,humidity,windspeed,casual,registered,count
> | fit DecisionTreeRegressor "casual" from "season" "holiday" "workingday" "weather" "temp" "atemp" "humidity" "windspeed"
> | multireport
> [ score r2_score "casual" against "predicted(casual)"
> | eval rSquared = round(r2_score,4) ]
> [ score mean_squared_error "casual" against "predicted(casual)"
> | eval RMSE = round(sqrt(mean_squared_error),2) ]
> | table RMSE rSquared
> | stats first(*) as *
> ' -preview false
RMSE  rSquared
----- --------
12.42   0.9381
Modelをつくって、test.csvにapplyさせる
上のCが一番スコアが良いので、つかってみる。
index="bike" sourcetype="csv-bike" source=*/train.csv
| table _time,season,holiday,workingday,weather,temp,atemp,humidity,windspeed,casual,registered,count
| fit DecisionTreeRegressor "casual" from "season" "holiday" "workingday" "weather" "temp" "atemp" "humidity" "windspeed" into dtr_casual
index="bike" sourcetype="csv-bike" source=*/train.csv
| table _time,season,holiday,workingday,weather,temp,atemp,humidity,windspeed,casual,registered,count
| fit DecisionTreeRegressor "registered" from "season" "holiday" "workingday" "weather" "temp" "atemp" "humidity" "windspeed" into dtr_registered
index="bike" sourcetype="csv-bike"
| table _time,season,holiday,workingday,weather,temp,atemp,humidity,windspeed,casual,registered,count,source
| apply dtr_casual as p_casual
| apply dtr_registered as p_registered
| eval p_count = p_casual + p_registered
| eval count=if(source="/Users/mhyugaji/Desktop/CapitalBikeshare-Tripdata/kaggle-bike-sharing-demand/test.csv",p_count,count)
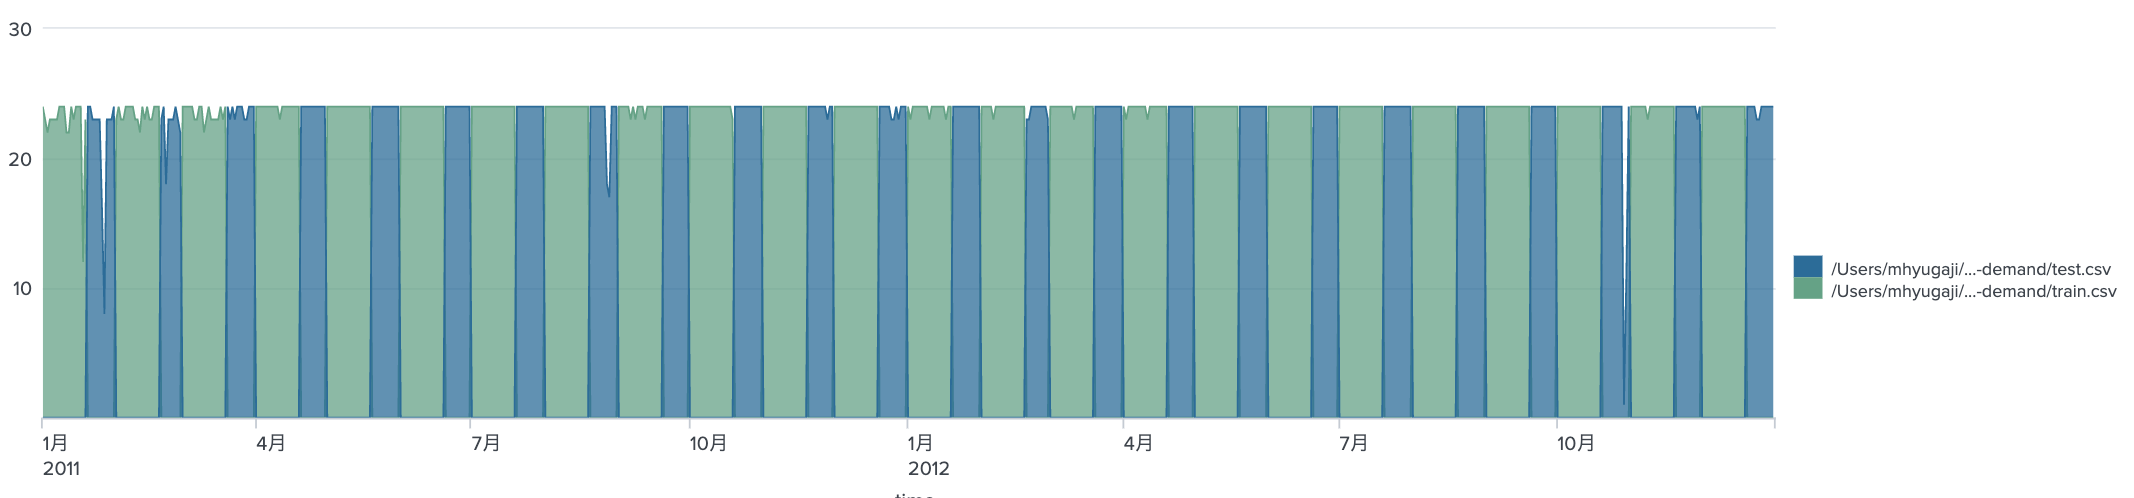
| timechart sum(count) span=1d by source
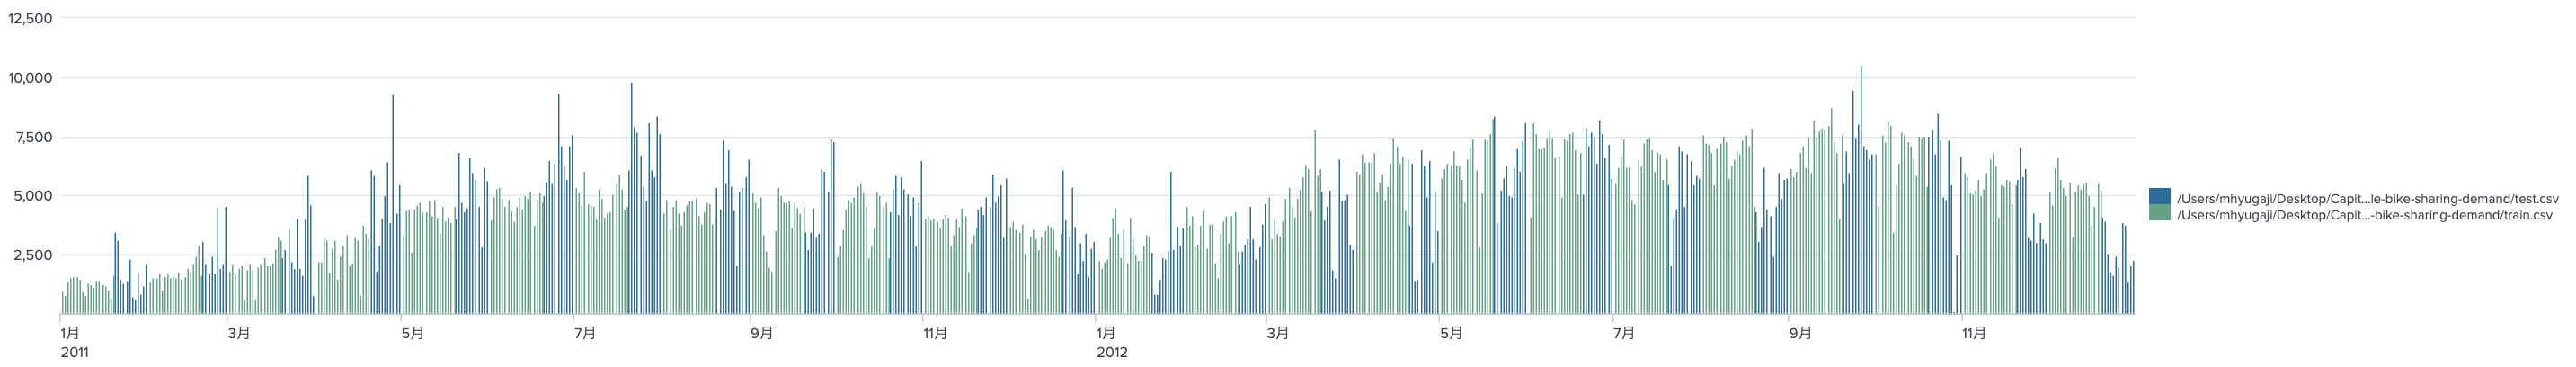
一応、test.csvへpredictを実施して、歯抜けになっていた部分がpredictによって埋められた。
index="bike" sourcetype="csv-bike" source="*/test.csv"
| table _time,datetime,season,holiday,workingday,weather,temp,atemp,humidity,windspeed,casual,registered,count
| apply dtr_casual as p_casual
| apply dtr_registered as p_registered
| eval count = round(p_casual + p_registered)
| table datetime,count
| outputcsv submit.csv
これでcsvに出力すると、以下の場所に保存される。
$ head -10 splunk/var/run/splunk/csv/submit.csv
datetime,count
"2012-12-31 23:00:00",51
"2012-12-31 22:00:00",54
"2012-12-31 21:00:00",51
"2012-12-31 20:00:00",85
"2012-12-31 19:00:00",85
"2012-12-31 18:00:00",94
"2012-12-31 17:00:00",94
"2012-12-31 16:00:00",94
"2012-12-31 15:00:00",97
さてさて、predictしたのでせっかくだから実測値と合わせてみたいという感じになるかとおもいますが、ここまでにしておきます。
先に進む前に
ぜひ以下のサイトをみて、Kaggleでの他の方々の例を見ながら試行錯誤&煮るなり焼くなりするといいと思います。
- https://www.kaggle.com/viveksrinivasan/eda-ensemble-model-top-10-percentile
- https://www.kaggle.com/c/bike-sharing-demand/notebooks
この先
Notebookみたいな表記にする場合って、Splunk SInvestigateとか使うときれいにできそうですね。
https://www.splunk.com/en_us/software/devops-incident-management-and-troubleshooting.html
以下のサイトにtest.csvで抜け落ちていたレンタル数があるので比べてみるのもよしだとおもいます。
Station Identificationでpredictionかけて、State Space ForecastにHolidayとか食わせて先々の需要を予測するというのもよいのでしょうかね。
それとも、もっと大きなデータで複雑なことをしたい、もっとずぼーーっと沼にハマりたい方は、以下からドッカンともっていくのもよいとおもいます。
- CapitalBikeShareのヒストリカルデータ https://s3.amazonaws.com/capitalbikeshare-data/index.html
- レンタル自転車のステーションデータ https://opendata.dc.gov/datasets/capital-bike-share-locations/data
- NOAAでの時間ごとの気象データ https://www.ncei.noaa.gov/data/global-hourly/access/ (2405013743.csvがDCのステーションデーター)
$ for y in $(seq 2010 2019)
> do
> curl -o ${y}_2405013743.csv https://www.ncei.noaa.gov/data/global-hourly/access/${y}/72405013743.csv
> done
- DCの休み情報 https://dchr.dc.gov/page/holiday-schedules もっと昔のは、どっかのカレンダーから引っ張ってくるか、holidayのLookupサービスつかうか。
- 関連する古い論文こういうのたまによむのもいいのかな。。(いや、最新の論文読んだほうがいい。https://link.springer.com/article/10.1007/s13748-013-0040-3
- CapitalBikeShareのリアルタイムデータもあるので、いじってみると面白い。
- 自転車の利用場所や時間帯の傾向の異常値をだして、街で事件が起こっていたのか、ホコ天があったのか、トランプさんがなんかいってデモがおこったのか、なんていうのをみつけるきっかけとしての自転車の動きを見るのもいいのかもしれませんなぁ。。

では!