概要
標準C++のみではグラフィックスが描画できないが、Sixel対応ターミナルを使えばグラフィックス描画できる。
Windowsでの対応ターミナル
- Windows Terminal Preview 1.22以降
- Mintty
が対応している。
2024/9現在、PreviewでないWindows Terminalがあと少しで対応しそうで、対応したら活用が進むかもしれない。
Sixelとは?
が主要な情報源に思われる。まとめると、
単位:
- 幅x高が1x6ピクセルのまとまりをSixelと呼ぶ
- 高さ6ピクセルの帯をSixel行と呼ぶ
色:
- 256色のパレットで色を扱う(256色以上扱えるターミナルもあるが未調査)
- 1文字のSixelでは一色しか表現できない
- 同一のSixel位置で複数色を表現したい場合は、キャリッジリターン後に同じ位置まで進め重ね書きする
描画位置の変更手段:
- Sixel出力:1文字のSixel出力で1Sixel分だけ右に移動する
- キャリッジリターン(
$):現Sixel行の先頭に移動する - 改行(
-):次のSixel行の先頭に移動する
基本処理
1つのSixel行について、
- Sixel内の上から1番目のピクセルのみ書いていきキャリッジリターン
- 同一Sixel行においてSixel内の上から2番目のピクセルのみ書いていきキャリッジリターン
- 同一Sixel行においてSixel内の上から3番目のピクセルのみ書いていきキャリッジリターン
- ...
- 同一Sixel行においてSixel内の上から6番目のピクセルのみ書いていき改行
とすれば、効率は悪いけれど簡単に変換できそう。また、効率を良くしてもワーストケースではこうなりそう。
これを実装すると、
#include <cstdint>
#include <format>
#include <iostream>
#include <string>
#include <vector>

using std::format;
using std::string;
using std::vector;

struct Color { uint8_t r, g, b, a; };

string toSixel(const vector<Color>& palette, vector<uint8_t> data, int w) {
  int h = data.size() / w;
  string s{"\x1bPq"};
  s += format("\"1;1;{};{}", w, h);
  for (int i = 0; auto color : palette) {
    auto to100 = [](uint8_t c) { return c * 100 / 255; };
    s += format("#{};2;{};{};{}", i++, to100(color.r), to100(color.g), to100(color.b));
  }
  for (int y = 0; y < h; ++y) {
    for (int x = 0; x < w; ++x) {
      uint8_t i = data[y * w + x];
      s += format("#{}", i);
      s += '?' + (1 << y % 6);
    }
    s += (y % 6 == 6 - 1) ? '-' : '$';
  }
  s += "\x1b\\";
  return s;
}

int main() {
  vector<Color> palette = {{0, 0, 0}, {255, 0, 0}, {0, 255, 0}, {0, 0, 255}};
  vector<uint8_t> data = {
    3, 1, 1, 1, 1, 1, 1, 3,
    1, 1, 0, 0, 0, 0, 1, 1,
    1, 0, 0, 2, 2, 0, 0, 1,
    1, 0, 2, 3, 3, 2, 0, 1,
    1, 0, 2, 3, 3, 2, 0, 1,
    1, 0, 0, 2, 2, 0, 0, 1,
    1, 1, 0, 0, 0, 0, 1, 1,
    3, 1, 1, 1, 1, 1, 1, 3,
  };
  int dataWidth = 8;
  std::cout << toSixel(palette, data, dataWidth) << std::endl;
}
となり、
$ clang++ -std=c++20 -O2 sixel.cpp
でコンパイルする。
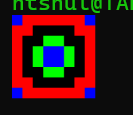
これで、パレットと配列を指定した描画ができた。
拡大
小さくて確認しづらいのでSixel化する前に拡大しよう。(これ自体はSixelに依存した処理ではない)
後にRGBA8データにも使えるようテンプレートにしている。
template <class T>
vector<T> toScaled(const vector<T>& data, int w, int s) {
  int h = data.size() / w;
  vector<T> outData;
  outData.reserve(s * w * s * h);
  for (int y = 0; y < h; ++y) {
    for (int yi = 0; yi < s; ++yi) {
      for (int x = 0; x < w; ++x) {
        T c = data[y * w + x];
        for (int xi = 0; xi < s; ++xi) {
          outData.push_back(c);
        }
      }
    }
  }
  return outData;
}

int main() {
  // ...
  int s = 8;
  auto scaledData = toScaled(data, dataWidth, s);
  int scaledDataWidth = s * dataWidth;
  std::cout << toSixel(palette, scaledData, scaledDataWidth) << std::endl;
}
RGBA8処理
RGBA8を処理するには、パレットありデータに変換すればよい。
パレットは最大256色までなのでRGBの各成分を2ビットで表現して、64色のパレットで表現することにする。
(これもSixelに依存した処理ではない)
2ビットだと4諧調しか表現できず表現力が低すぎるので、簡単なディザリングも実装する。
vector<Color> createRgb2Palette() {
  vector<Color> palette;
  for (int ri = 0; ri < 4; ++ri) {
    for (int gi = 0; gi < 4; ++gi) {
      for (int bi = 0; bi < 4; ++bi) {
        auto to255 = [](int i) { return static_cast<uint8_t>(i * 255 / (4 - 1)); };
        palette.push_back({to255(ri), to255(gi), to255(bi)});
      }
    }
  }
  return palette;
}

vector<uint8_t> toDataForRgb2Palette(const vector<Color>& data, int w) {
  int h = data.size() / w;
  vector<uint8_t> outData;
  outData.reserve(w * h);
  for (int y = 0; y < h; ++y) {
    for (int x = 0; x < w; ++x) {
      const Color& c = data[y * w + x];
      auto to4 = [](int mod4X, int mod4Y, uint8_t cc) {
        static uint8_t dither[4][4] = {
          0x0, 0x8, 0x2, 0xa,
          0xc, 0x4, 0xe, 0x6,
          0x3, 0xb, 0x1, 0x9,
          0xf, 0x7, 0xd, 0x5,
        };
        int i49 = cc * 49 / 256;
        return i49 / 16 + (dither[mod4Y][mod4X] < i49 % 16);
      };
      int mod4X = x % 4, mod4Y = y % 4;
      uint8_t i = (
        (to4(mod4X, mod4Y, c.r) << 4) +
        (to4(mod4X, mod4Y, c.g) << 2) +
        (to4(mod4X, mod4Y, c.b) << 0));
      outData.push_back(i);
    }
  }
  return outData;
}
4x4ディザリングありでの諧調は49諧調になる。
これは、2ビットは4諧調で、それぞれの間の4x4ディザリングが16諧調なので、16 * (4 - 1) + 1 = 49 から求まる。
これで変換してパレットありデータにし、対応したパレットとともに、toSixel に渡せばRGBA8のSixel文字列が生成できる。
RGBA8の動作確認
動作確認のために簡単な矩形塗り関数を作ろう。
#include <algorithm>

// ...

void fillRect(vector<Color>& data, int dataW, int x, int y, int w, int h, const Color& color) {
  int dataH = data.size() / dataW;
  int sx = std::clamp(x, 0, dataW);
  int sy = std::clamp(y, 0, dataH);
  int ex = std::clamp(x + w, 0, dataW);
  int ey = std::clamp(y + h, 0, dataH);
  for (int yi = sy; yi < ey; ++yi) {
    for (int xi = sx; xi < ex; ++xi) {
      data[yi * dataW + xi] = color;
    }
  }
}
あとは、適当に描画する。
#include <cmath>

// ...

int main() {
  for (int ti = 0; ti < 10000; ++ti) {
    int w = 256, h = 256;
    vector<Color> data(w * h);
    for (int i = 0; i < 16; ++i) {
      Color c{
        static_cast<uint8_t>(128 + 127.9f * std::sin(0.03f * ti + 0.1f * i)),
        static_cast<uint8_t>(128 + 127.9f * std::sin(0.04f * ti + 0.1f * i)),
        static_cast<uint8_t>(128 + 127.9f * std::sin(0.05f * ti + 0.1f * i)),
      };
      int x = 128 + 64 * std::cos(0.05f * ti + 0.2f * i) - 16;
      int y = 128 + 64 * std::sin(0.06f * ti + 0.2f * i) - 16;
      fillRect(data, w, x, y, 32, 32, c);
    }
    std::cout << toSixel(createRgb2Palette(), toDataForRgb2Palette(data, w), w) << std::endl;
  }
}
ループで描画しつづければアニメーションに見せることもできる。
まとめ
簡単なグラフィックス表示を標準C++だけでできるようになりそう。


